Tire Load Capacity: The TRA Load Formula and a Proposed Revisions
This chapter traces the evolution of the TRA (Tire and Rim Association) load-carrying capacity formula for passenger tires, compares it with an alternative approach based on constant relative deflection, and proposes a new formula better suited to modern low-profile, large-rim tires.
Keywords: tire load capacity; TRA formula; tire deflection; tire stiffness; load index; rolling circumference
1. Introduction
Since its founding in 1903, the Tire and Rim Association (TRA) has set tire interchangeability standards covering load, dimensions, rim contours, and valves. The load formula is empirical, derived from member-company data and field experience. For a given pressure, the load limit is the maximum rated capacity; conversely, the listed pressure is the minimum recommended for that load. The formula’s goals are: (a) enable interchangeable tires across manufacturers; (b) provide progressive load ratings within a product line; (c) balance OEM requirements with real-world service.
2. History of the TRA Load Formula
Before 1928, load ratings were negotiated by manufacturers. Loads were independent of rim diameter, proportional to section width, and directly proportional to inflation pressure: L = L₀(P/P₀). In 1928, rim diameter was introduced. The first formal formula was developed by mathematician C.G. Hoover in the mid-1930s, incorporating pressure, section width, and rim diameter — designed to maintain uniform deflection across tire sizes.
The early “low-pressure passenger tire” formula was:
Revised in 1936 to:
Since then, the input parameters (section width S, rim diameter DR, pressure P) have remained the framework; only coefficients and exponents have been adjusted for new tire types and metrication.
3. Derivation of the Base Formula
Schuring (1985) reconstructed the logic: the load-pressure relationship was made sub-linear with exponent n = 0.585, and load was assumed proportional to internal air volume V. Early tires had near-circular cross-sections where V ∝ S²(DR + S), leading to:
Because torus volume is not strictly proportional to S², the exponent was reduced from 2 to 1.39 based on field experience:
4. The Constant K (Service Factor)
The coefficient K adjusts for tire type and service condition: truck/bus tires use K=1.00; passenger tires originally used K=1.10. The 0.425 factor was introduced to bring K near 1.00. When P-metric tires were introduced in the 1970s, metric conversion constants were merged into a revised K.
5. Pressure Exponent
The exponent 0.585 limits how quickly load grows with pressure — as pressure rises, tire stresses increase, so a sub-linear exponent caps deflection and stress. When P-metric tires were introduced, the exponent was reduced to 0.50. P-metric design load pressure rose from 26 psi to 28 psi; max load pressure from 32 psi to 35 psi.
6. Section Width (Equivalent Section Diameter)
Early tires had circular cross-sections (aspect ratio = 1.00). As tires became wider and lower-profile, the cross-section became elliptical. An equivalent section diameter Sd was introduced to preserve the circular-section calculation logic — the perimeter of an elliptical cross-section is converted to an equivalent circle.
7. Why a Formula Review Is Needed
Tire sizes have proliferated dramatically: from 91 sizes in 1975 to 145–345 by 2003; aspect ratios now range from 30 to 80; rim diameters from 12 to 22 inches. The original formula assumed circular cross-sections. Meanwhile, TPMS regulations allow tires to run at reduced pressure (increased deflection) before warning. The current formula unfairly penalizes large-rim, low-profile tires.
8. A New Research Approach: Load–Deflection and Stiffness
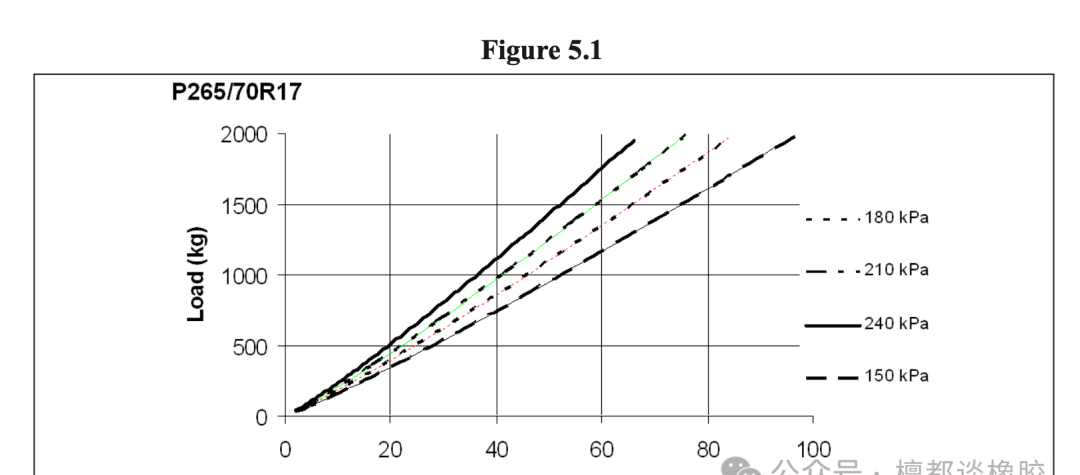
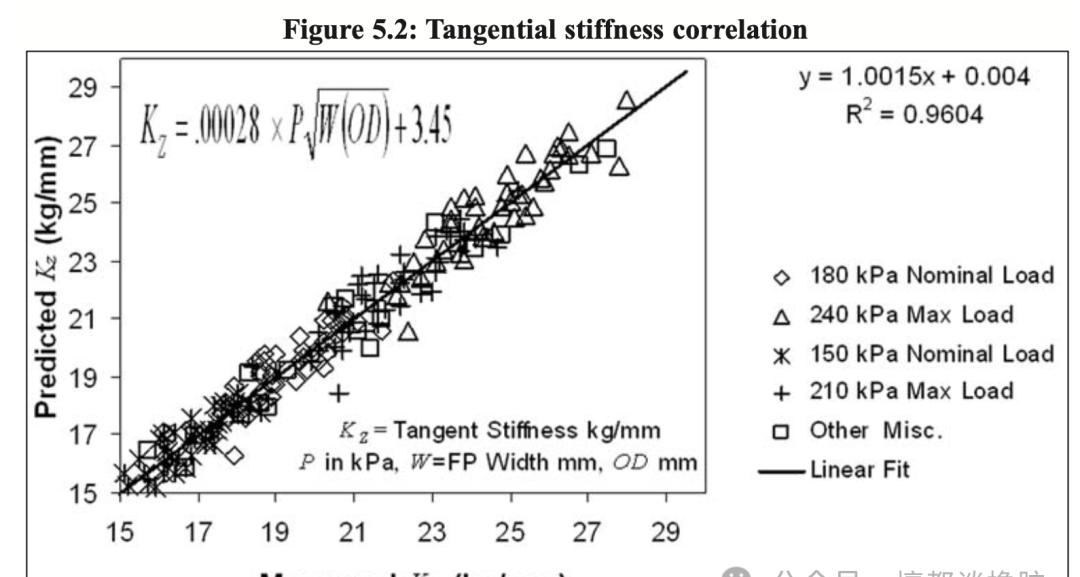
Industry consensus: at normal operating pressure, inflation pressure and tire dimensions (tread width, outer diameter) determine stiffness; tire structure itself contributes only 10–15%. Rhyne extended Koutny’s torus model to compute vertical stiffness directly. The tangent stiffness KZ is a function of pressure P, contact patch width W, and outer diameter OD:
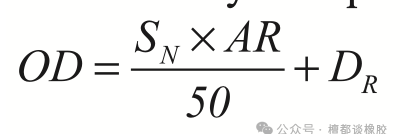
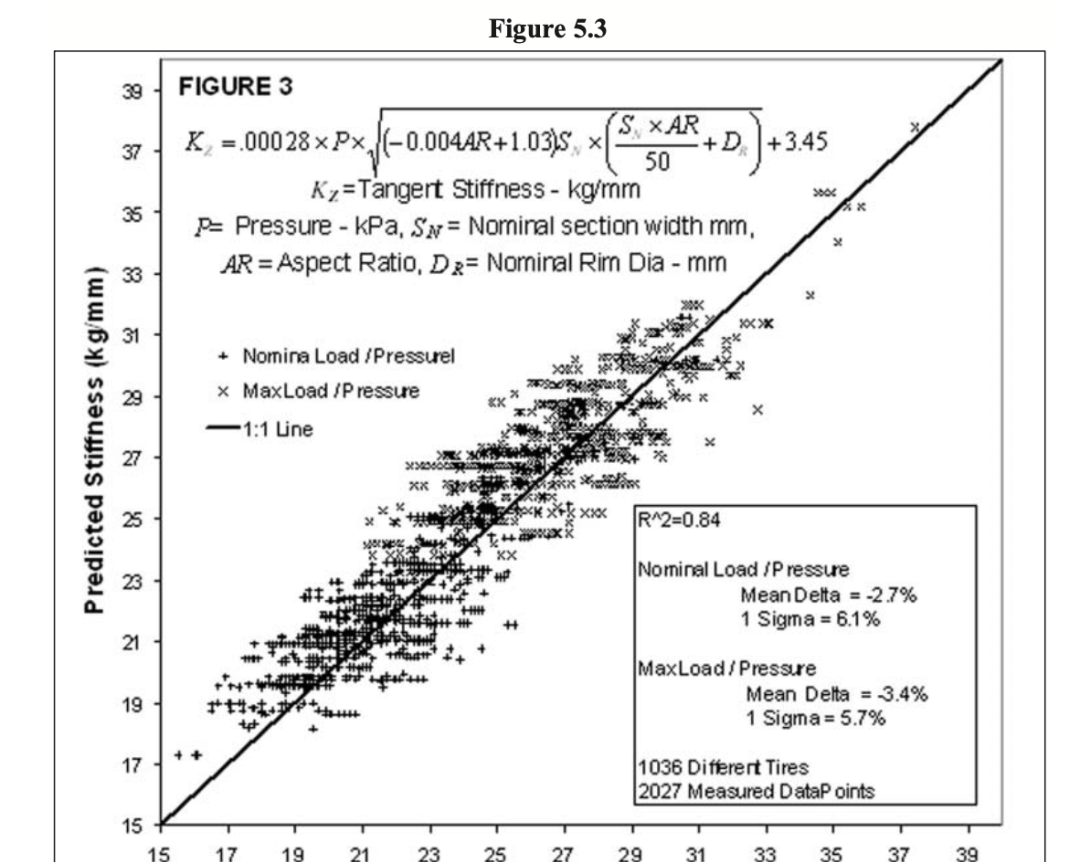
Validated against 50 tires across 34 sizes with good correlation. The contact patch width W relates to nominal section width SN and aspect ratio AR via empirical coefficient a:
Table: Coefficient a by aspect ratio
AR
25
30
35
40
45
50
55
60
65
70
75
80
a
0.97
0.93
0.91
0.89
0.87
0.85
0.83
0.81
0.77
0.75
0.73
0.71
The stiffness model was validated against 2,027 test data points across 144 sizes and 1,000+ tires (rim 13–24″, section width 175–305 mm, aspect ratio 35–80), achieving R² = 0.84 between predicted and measured stiffness.
9. TRA Load Formula vs. Deflection
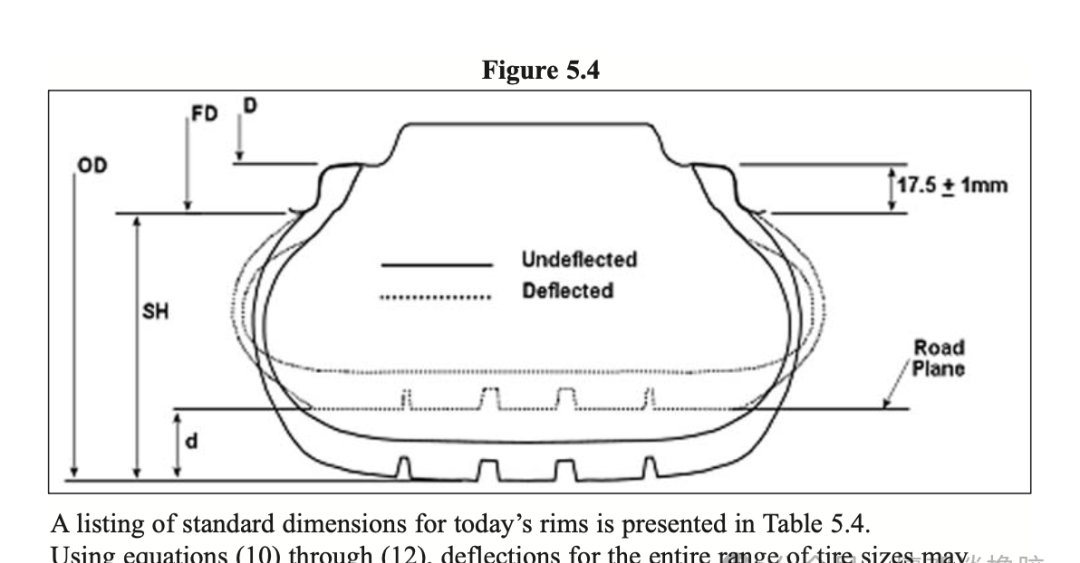
Tire engineers discuss load and pressure, but what really determines tire life is deflection. Greater deflection means more strain, more heat buildup, higher operating temperature, and greater rolling loss. The static deflection under any load-pressure combination is simply:
where d = deflection (mm), L = load (kg), KZ = tangent stiffness (kg/mm). For cross-size comparison, use relative deflection as a percentage of section height above the rim flange (SH).
10. Deflection Analysis
Applying the current TRA load formula across sizes reveals a systematic bias:
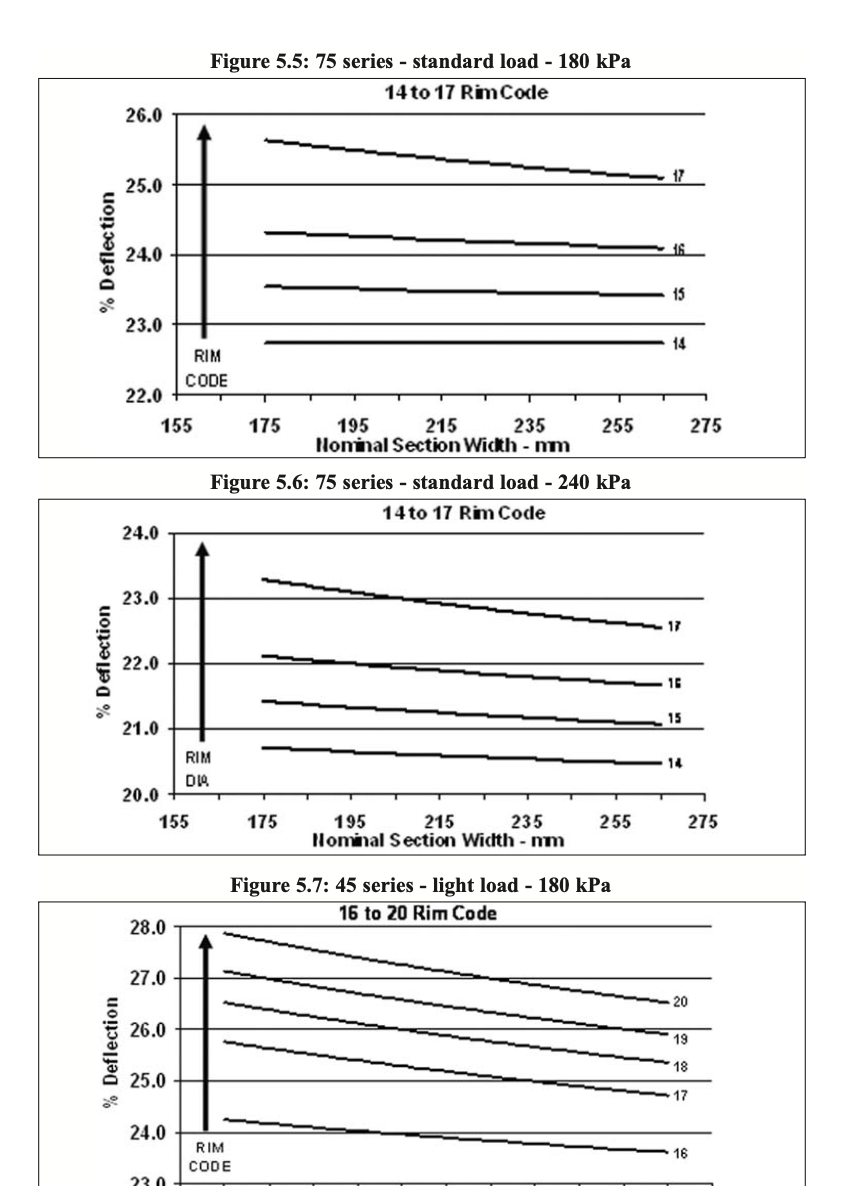
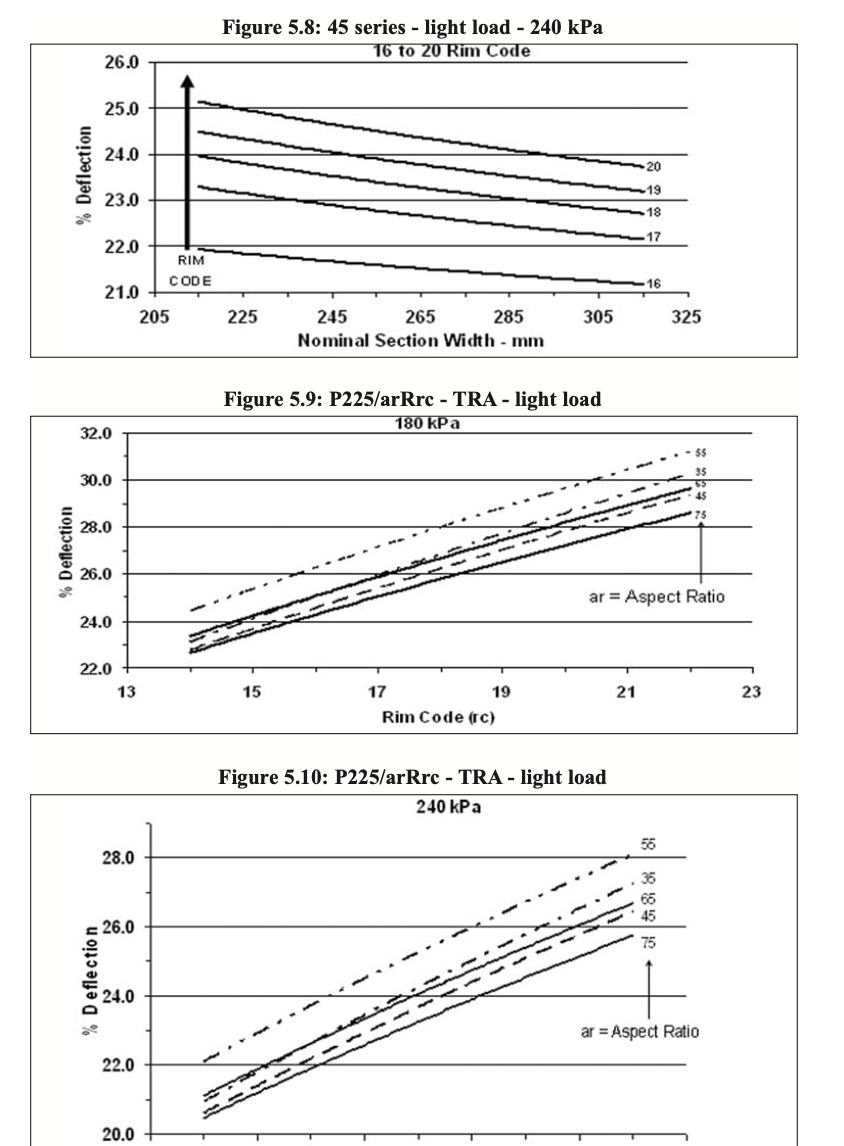
75-series tires at 180 and 240 kPa: as section width increases, relative deflection slightly decreases; as rim diameter increases, deflection rises significantly.
45-series low-profile tires: identical trend.
Fixed section width, varying rim code: same aspect ratio geometry, only total diameter changes. Larger rim → higher relative deflection.
The current TRA formula penalizes large-rim tires: bigger rims require the tire to operate at higher deflection, accelerating fatigue and heat buildup.
11. Proposed Load Formula Based on Constant Relative Deflection
To eliminate the bias against low-profile, large-rim tires, a new formula is proposed based on constant relative deflection. Since rim flange height is a constant 17.5 mm on modern passenger rims, deflection can be expressed in terms of nominal section width and aspect ratio. Combining with the stiffness model yields a general load formula valid across all passenger tire sizes:
For maximum load calculations, use 240 kPa (the current P-metric standard-load reference pressure). Select the appropriate relative deflection percentage for the aspect ratio and compute load. Comparing the new formula with the existing TRA formula for 70-series tires confirms that the old formula underrates large-rim tires relative to the constant-deflection approach.
12. Future Work
The constant-deflection method needs further research to determine appropriate relative deflection targets for different tire categories. Whether 75-series and 30-series tires should share the same deflection threshold requires test data. The stiffness model also needs refinement for current and future tire designs. ISO has begun discussions on this approach.
Summary
The tire load formula has served for decades but needs revision for modern low-profile, large-rim tires. The proposed method based on constant relative deflection provides a physically grounded framework for evaluating current load ratings and developing future standards — covering everything from section width and aspect ratio to rim diameter and inflation pressure.
https://www.hbtrubber.com/wp-content/uploads/2026/09/header_2684.jpg6751200zhaohttps://www.hbtrubber.com/wp-content/uploads/2026/03/LOGO-3.pngzhao2026-09-27 15:11:172026-09-28 02:26:36Tire Load Capacity: TRA Formula History & Proposed Revision
Understanding UN GTR No.16: Global Technical Regulations for Tires
UN Global Technical Regulation No.16 (UN GTR No.16) establishes unified performance requirements for new pneumatic radial tires used on vehicles with gross mass up to 4,536 kg (10,000 lbs). This guide summarizes the regulation’s scope, test methods, key thresholds, and the history of its amendments.
Keywords: UN GTR 16; tire regulation; tire testing; rolling resistance; wet grip; tire noise; endurance test; bead unseating
Regulation Background
UN GTR No.16 was developed under the 1998 UN Agreement, harmonizing tire requirements drawn primarily from four core documents: UN R30, UN R54, UN R117, and US FMVSS 139. Before harmonization, tire makers produced nearly identical tires but had to make region-specific changes for different markets — particularly sidewall markings — driving up costs. The regulation aims to enable a “global tire” that meets all major markets with one product.
Development History
2004: Informal work began in Paris; France led the proposal.
2006: AC.3 formally approved the project at WP.29 session 140.
2009: AC.3 approved a two-phase approach: Phase 1 for passenger car tires, Phase 2 for LT/C (light truck/commercial) tires.
Original GTR-16: Harmonized passenger car tire requirements; LT/C provisions from existing UN/US regulations were included as non-harmonized placeholders.
Amendment 1 (2016): Updated wet grip to latest R117; added rolling resistance and severe-snow tire grading tests.
Amendment 2: Harmonized LT/C tire physical dimensions and high-speed performance tests, incorporating latest R30, R54, and FMVSS updates.
Key harmonized areas: high-speed performance, physical dimensions, mandatory sidewall markings. Tests that existed in only one regulation (endurance, low-pressure endurance, bead unseating, strength, rolling noise, wet grip, run-flat) were adopted directly without reconciliation.
Scope
Applies to new pneumatic radial tires for Category 1 and 2 vehicles (gross mass ≤4,536 kg). Does not apply to:
T-type temporary spare tires
Rim diameter code ≤8 (≤203 mm)
ST special trailer tires
LT/C tires with tread depth ≥14.3 mm (18/32″)
C3 category tires (except load index 122–131 with LT/C designation)
Sidewall Markings
The Tire Identification Number (TIN) follows format YYY-MMMMMM-DDDD:
YYY: 3-digit global plant code (assigned by NHTSA)
MMMMMM: 6-digit manufacturer code (internal)
DDDD: 4-digit date code (2 digits week + 2 digits year, e.g., 0110 = week 1 of 2010)
Required markings include: manufacturer/trademark (≥4 mm), commercial name, country of origin, size designation (≥6 mm), R (radial) or RF (run-flat radial), service description, max load/pressure, M+S or alpine (three-peak mountain snowflake) symbols, and TWI.
Key Test Requirements
High-Speed Performance Test
Drum diameter 1.7 m or 2.0 m; load = 85% of max rated load. For speed symbols F–S: 90 minutes continuous at 140 → 150 → 160 km/h (30 min each). For T–Y: staged test starting at ITS (rated speed minus 20 km/h), with 10–20 min steps up to rated speed. Pass criteria: no separation, chunking, cracks, or cord breaks; pressure after 15–25 min must be ≥95% of initial; outer diameter change after 2 hours within ±3.5%.
Strength Test
Hemispherical indentor (19 mm diameter) pressed at 50 mm/min into inflated tire. Minimum destruction energy:
Section width
Standard/LL
Extra Load
<160 mm
220 J
441 J
≥160 mm
294 J
588 J
Bead Unseating Resistance
Minimum unseating force applied at ≥4 points around circumference:
Section width
Min force (N)
<160 mm
6,670
160–204 mm
8,890
≥205 mm
11,120
Endurance Test (Passenger Car)
On 1.7 m drum at 120 km/h (110 km/h for snow tires):
4 hours at 85% load
6 hours at 90% load
24 hours at 100% load
Followed immediately by 90 minutes low-pressure endurance. Pass: no separation, chunking, cracks, or cord breaks.
Rolling Noise Limits (dB(A))
Class
Standard
Snow
Severe Snow
Special Use
C1 (passenger)
70
70
71
72
C2 (light truck)
72
72
73
74
C3 (commercial)
73
73
74
75
Wet Grip Index (G) Minimum Requirements
Class
Tire Type
Min G
C1
Standard / Snow
≥1.10
C1
Severe Snow (R+)
≥1.00
C2
Standard / Snow
≥0.95
C2
Traction / Severe Snow
≥0.85
C3
Standard
≥0.80
C3
Traction / Snow
≥0.65
Rolling Resistance Coefficient (Cr) Maximum
Class
Max Cr (N/kN)
C1 (passenger)
≤10.0
C2 (light truck)
≤9.0
C3 (commercial)
≤6.5
Severe snow tires get +1 N/kN allowance. Test at 80 km/h (C1/C2 LI≤121) or 60/80 km/h (C2/C3 LI>121), on a drum test stand using force, torque, or deceleration methods.
Severe Snow (Three-Peak Mountain Snowflake)
Three optional test methods: snow braking (C1), spin traction per ASTM F1805-06 (C1/C2), or snow acceleration (C3). Minimum Snow Grip index: C1 ≥1.07 (braking), C2 ≥1.02 (spin traction), C3 ≥1.25 (acceleration).
Speed Symbols
Symbol
km/h
Symbol
km/h
F
80
R
170
G
90
S
180
J
100
T
190
K
110
U
200
L
120
H
210
M
130
V
240
N
140
W
270
P
150
Y
300
Q
160
Key Takeaways
Harmonization reduces cost: A single tire design meeting GTR-16 can be sold across multiple markets, cutting redundant testing and mold changes.
Three performance pillars: safety (endurance, high-speed, strength, bead retention), environment (rolling resistance, noise), and grip (wet, snow).
LT/C endurance remains non-harmonized: Two options remain — FMVSS-139 sequential test or UN-R54 (for Q-speed-and-below tires only).
Transition period up to 10 years allowed to amortize mold changes (tire molds last 5–10 years; NHTSA estimates full turnover within 13 years).
This Q&A guide covers the essential questions about rubber calendering — process principles, machine types, deflection compensation, calendering effect, pre-calendering preparation, sheet pressing, plying, profiling, fabric frictioning, and common quality defects with their root causes.
Calendering is the process of forming mixed rubber compound into sheets of specified thickness and width, or coating a thin rubber layer onto textile fabric. It covers rubber sheeting, profiling, topping, frictioning, plying, cold refining, and straining operations.
Principle: Rubber is fed between two rotating work rolls, drawn into the roll gap, and squeezed into a sheet of controlled thickness and width. During calendering, the compound undergoes both viscous flow and elastic deformation — so all calendering phenomena are closely tied to rubber flow behavior and viscoelasticity.
2. Calender Types and Model Designation
Calenders are classified by:
Number of rolls: two-roll, three-roll, four-roll.
Purpose: sheeting calenders (uniform roll speed, 3–4 rolls); frictioning calenders (roll speed ratios, usually 3-roll); universal calenders (adjustable speed ratios via auxiliary gears); profiling calenders (one engraved roll for patterned sheets); steel cord calenders (four-roll).
Roll arrangement: I-type, ▵-type, T-type, L-type, Z-type, S-type.
Specifications: Roll outer diameter × face length, e.g., Φ610×1730. Model example: XY-4T-1730 — XY = rubber calender; 4T = four-roll; 1730 = face length in mm.
3. Why Deflection Compensation?
Rubber passing through the roll gap exerts large separating force on the rolls. Combined with roll weight, this causes elastic bending called deflection, resulting in sheets that are thicker in the center and thinner at the edges. Compensation methods include:
Crown (camber) method — grinding a slight convex curve onto the roll.
Axis crossing — skewing one roll relative to the other.
Anti-bending (prestress) method — applying external bending moment opposite to the load.
4. What Is the Calendering Effect?
The calendering effect is the directional performance difference between longitudinal and transverse directions in calendered sheets: along the calendering direction (MD), tear strength is higher, elongation is lower, and shrinkage is greater; across the direction (TD), tear strength is lower, elongation is higher, and shrinkage is lower. It is caused by orientation of rubber molecules and needle/plate-shaped filler particles along the flow direction.
Elimination: minimize needle/plate fillers (calcium carbonate, clay, talc); raise calendering temperature to increase molecular mobility. Note: some products benefit from it (rubber cables need higher MD strength); others must eliminate it (balls require uniform strength). Test specimens should always be cut in the calendering direction.
5. Pre-Calendering Preparation
(1) Heat Refining (Warming)
Compound must be heat-refined on an open mill before calendering to improve filler dispersion and plasticity. Two stages:
Coarse refining: tight nip (2–5 mm), roll temp 40–45°C, 7–8 passes through tight nip — softens and homogenizes.
Fine refining: wider nip (7–10 mm), roll temp 60–70°C, 6–7 passes — raises temperature for uniform high plasticity.
Mill roll speed ratio is 1:1.7 to 1:1.28 for fast warming; maintain a proper rubber bank on the rolls.
(2) Feed Supply
Continuous feeding matching output; small, frequent additions to avoid trapping air.
(3) Pre-Start Inspection
Check roll surface (clean, smooth, uniform temperature, no damage), bearings, lubrication, temperature gauges, thickness gauges, wind-up device, and motor operation.
(4) Temperature Control
Synthetic rubber calender roll temps are lower than NR; upper roll runs hotter than middle/lower rolls. Temperature depends on formulation, plasticity, process, and line speed.
(5) Fabric Drying
Fabric must be dried before coating to 1–2% moisture content. Too much moisture weakens adhesion; too dry damages fabric and reduces strength. Do not let dried fabric sit — it reabsorbs moisture.
6. Sheeting Methods
Sheeting presses warm compound into uniform sheets at equal roll speeds. Two modes:
With rubber bank: maintain a small bank between middle and lower rolls — smooth surface, fewer bubbles, better density, but stronger calendering effect. Preferred for SBR. Do not over-fill (traps air).
Without rubber bank: opposite; preferred for natural rubber.
7. Sheeting Process Controls
Roll temperature: set by compound type. High rubber content / high elasticity requires higher temp. Maintain proper temperature differential between rolls for good sheet transfer. NR sticks to hotter rolls; butyl rubber sticks to colder rolls.
Plasticity: too high → sticks to rolls; too low → rough surface, high shrinkage. Moderate plasticity gives smooth sheets.
Roll speed: faster = higher output, but must match plasticity. High plasticity allows faster speed.
8. Sheet Quality: Defects and Causes
Requirements: smooth surface, uniform thickness, no wrinkles, no pre-vulcanized particles, dense interior with no bubbles.
Defect
Causes
Internal bubbles
High moisture in additives; volatile softener; too high calender temp; excessive rubber bank; improper feeding; wet rework compound; sheet too thick
Low plasticity; low roll temp; too fast speed; pre-vulcanized particles in compound
Uneven thickness
Uneven plasticity; compound temperature fluctuation; uneven roll gap; uneven wind-up tension
9. Plying (Topping)
Plying combines two thin calendered sheets into one thicker sheet — used for thick, high-quality sheets or sandwich constructions.
Two-roll plying: simple, up to 5 mm thick, but low precision.
Three-roll plying: pre-formed sheet/combined with freshly calendered sheet.
Four-roll plying: two sheets simultaneously calendered and combined inline — high efficiency, good precision, but stronger calendering effect.
Requirement: both layers must have equal plasticity — otherwise delamination or bubbles. For dissimilar formulations/thicknesses, prefer simultaneous plying — combine two freshly calendered hot sheets immediately from two lines for best seal and no bubbles.
10. Profiling
Profiling forms rubber into specific cross-sections or surface patterns — e.g., shoe soles, tire components. Requirements: accurate dimensions, clear pattern, dense compound.
High rubber content causes pattern collapse — add fillers, softeners, reclaim rubber, or factice.
Strictly control plasticity, refining degree, and rework ratio.
Cool the sheet immediately after leaving the calender to set the pattern before it deforms.
11. Fabric Coating: Purpose
Coating applies a thin rubber layer onto textile fabric (cord, canvas) to create carcass plies for rubber products. It bonds yarns and plies into a unified structure that shares load, while improving elasticity, water resistance, and overall product performance.
12. Fabric Coating Methods
Topping: two equal-speed rolls press a pre-formed rubber sheet onto the fabric surface.
Pressure topping: same as topping but with a rubber bank at the nip — bank pressure forces rubber into fabric gaps for better adhesion.
Frictioning: uses roll speed ratio to generate shear and squeeze rubber into fabric interstices for maximum bond.
Frictioning subtypes:
Middle-roll wrap (light frictioning): fabric passes between middle and lower rolls; partial rubber works into fabric, remainder stays on middle roll. High adhesion, low rubber pickup, poor flex fatigue.
No middle-roll wrap (heavy frictioning): all rubber works into fabric, middle roll carries no rubber. Thicker coating, better flex resistance, but lower adhesion and variable pickup.
13. Key Factors in Fabric Coating
Roll temperature: higher temp improves flow, smoothness, and penetration → better bond; but too high risks scorch.
Plasticity: higher plasticity = better flow and penetration = stronger bond, cleaner surface, less shrinkage.
Roll speed: faster speed means shorter compression time, more elastic recovery, weaker bond. Match speed to plasticity. Typical: thin fabric frictioning 5–25 m/min; heavy canvas 30–40 m/min.
14. Fabric Coating Defects and Causes
Defect
Causes
Rubber pick-off / delamination
Insufficient fabric drying / high moisture; oil or dust on fabric surface; low plasticity from poor heat refining; low calender temp; too fast speed; roll gap too large
Cord weaving / wandering
Uneven plasticity; loose fabric roll; excessive bank at middle roll; uneven weft density
Loose center / tight edges
Uneven tension; lower roll too hot (rubber sticks); inconsistent fabric density or elongation
https://www.hbtrubber.com/wp-content/uploads/2026/09/header_2678.jpg6751200zhaohttps://www.hbtrubber.com/wp-content/uploads/2026/03/LOGO-3.pngzhao2026-09-27 15:01:182026-09-28 02:36:24Rubber Calendering: Common Problems and Solutions
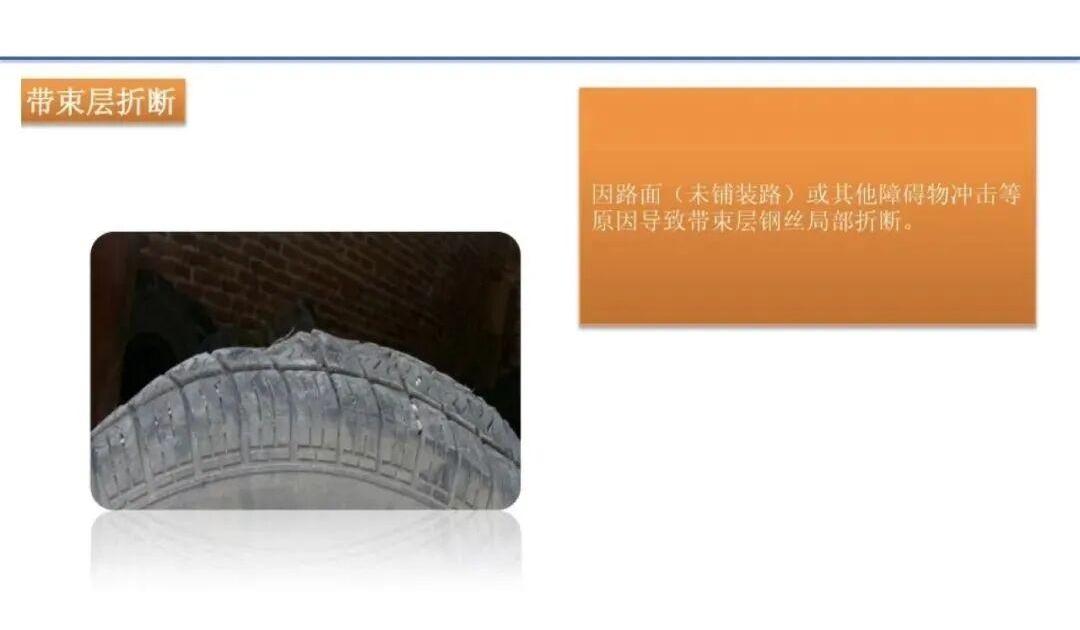
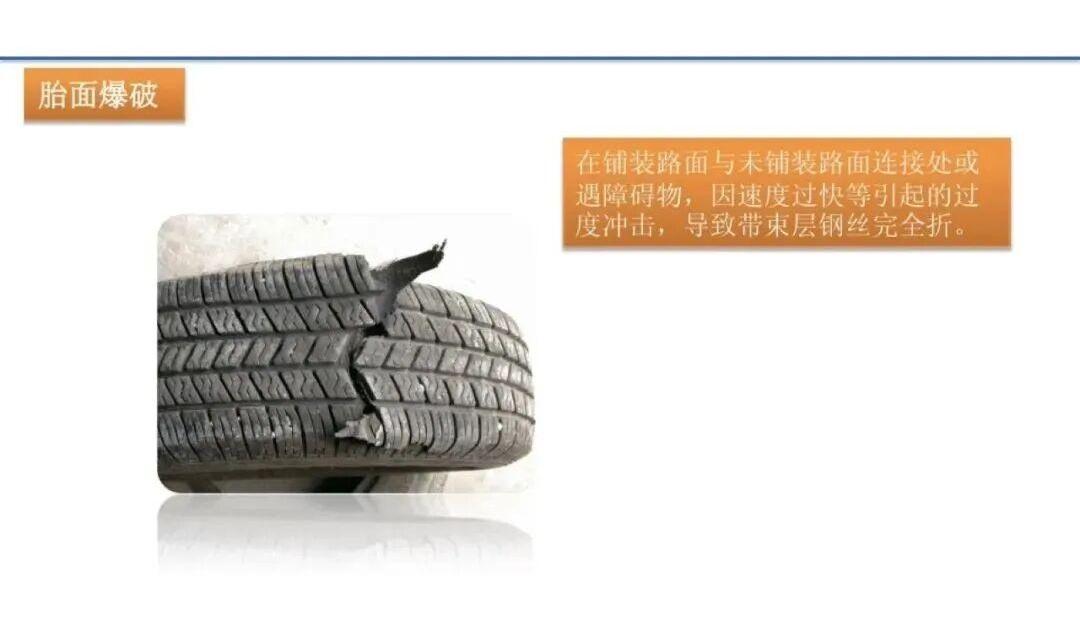
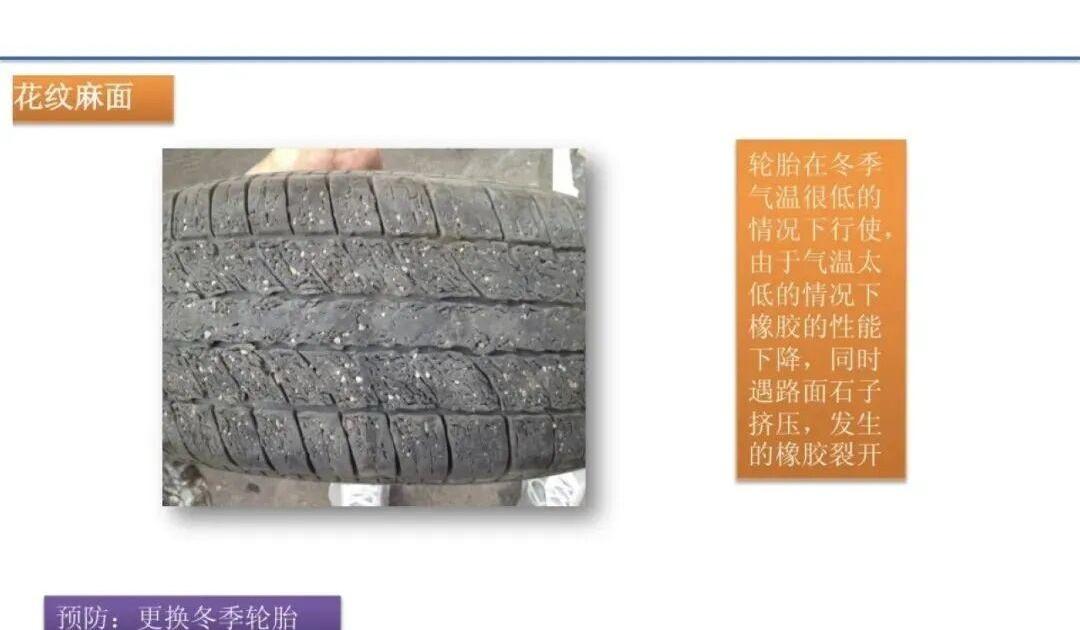
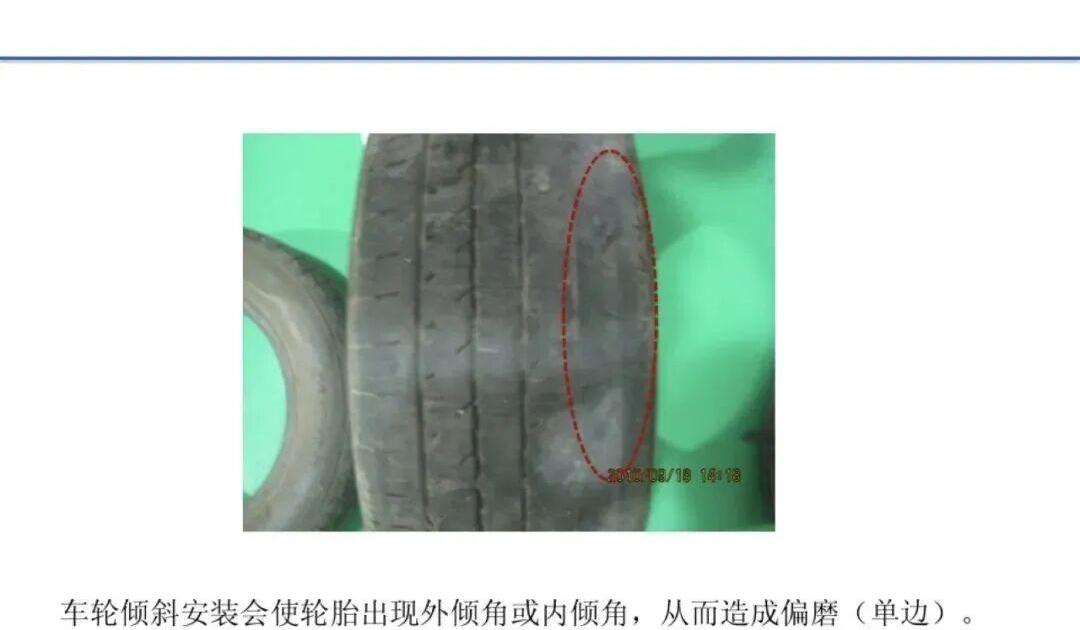
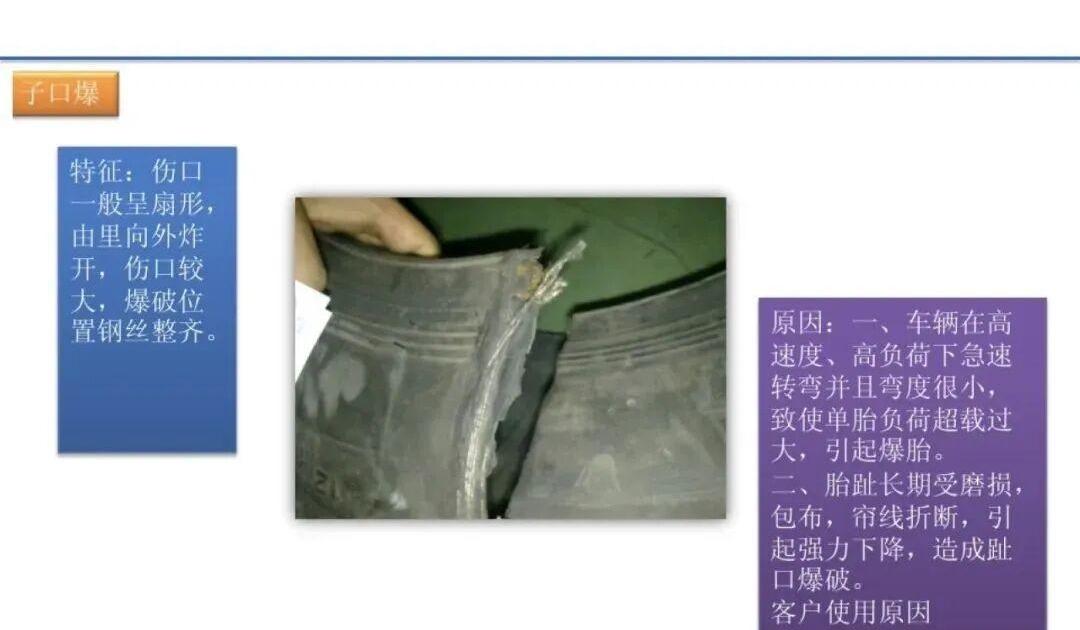
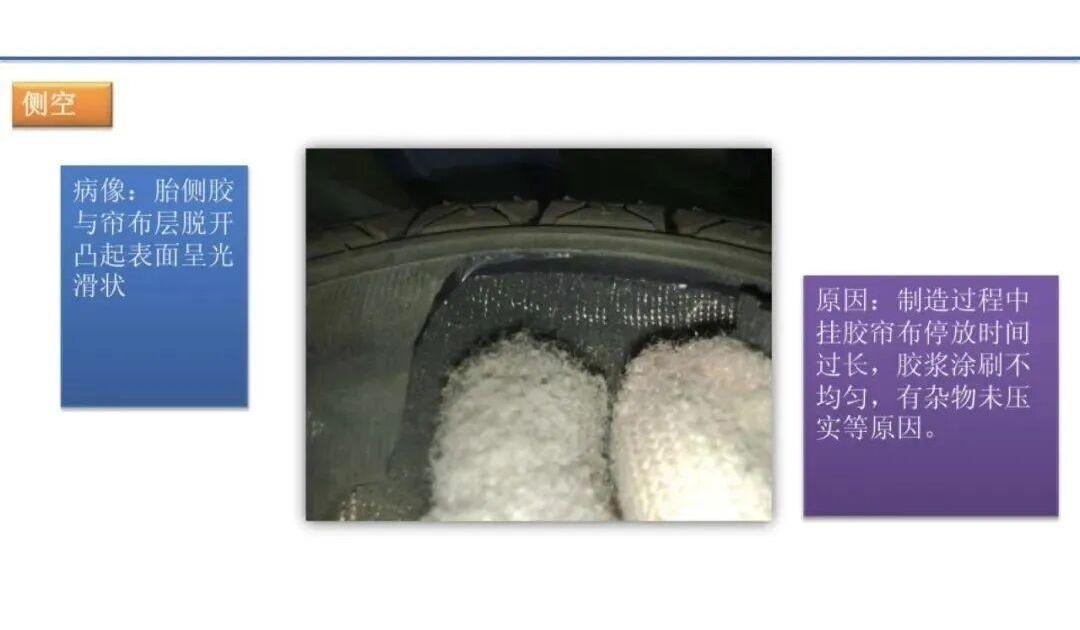
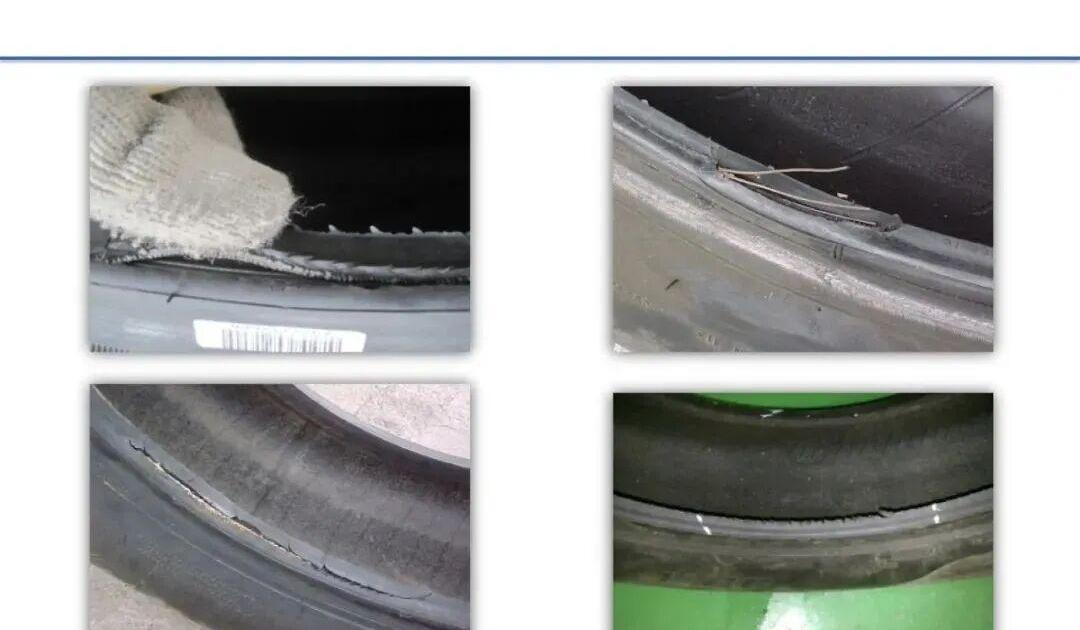
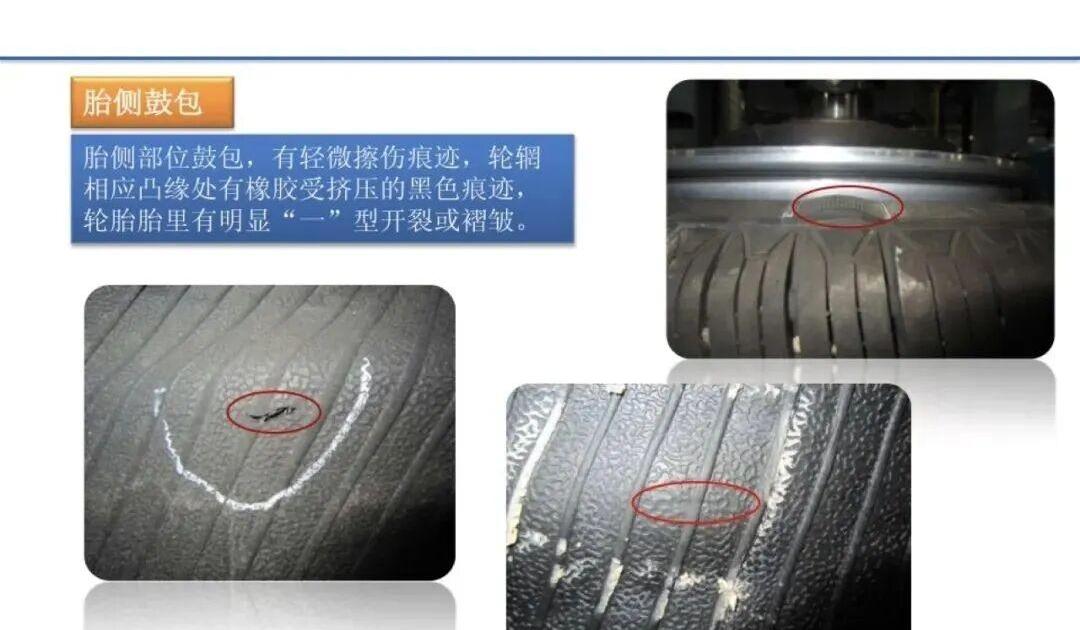
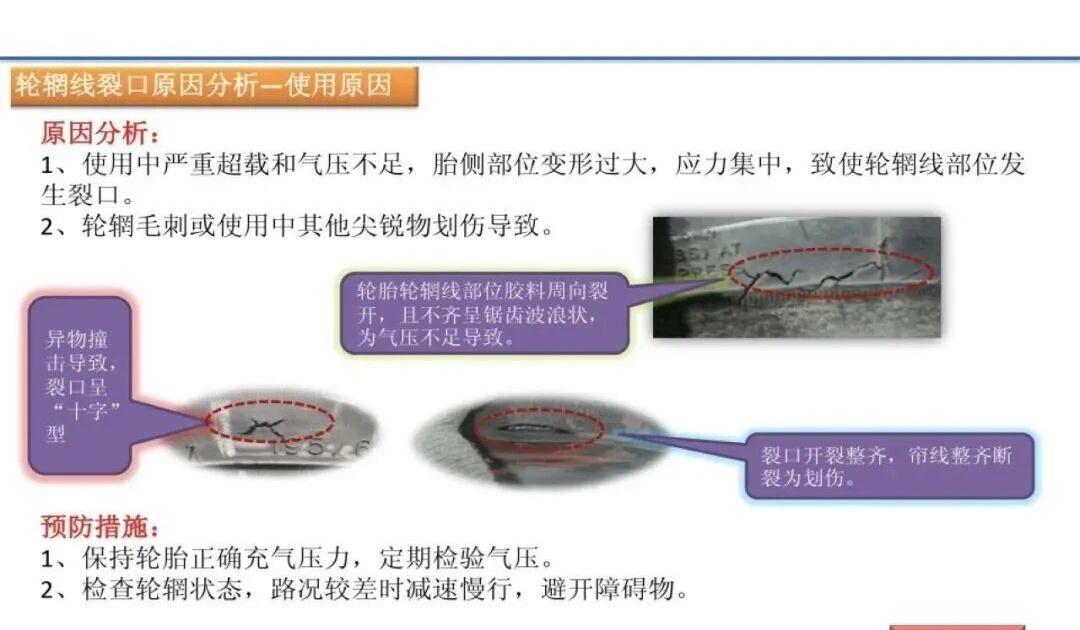
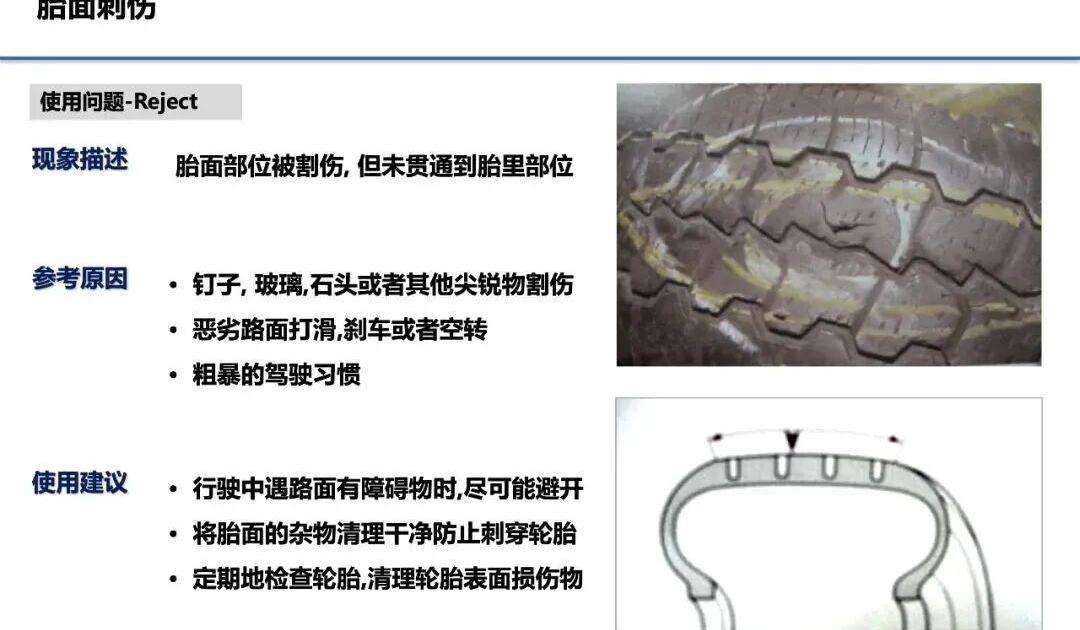
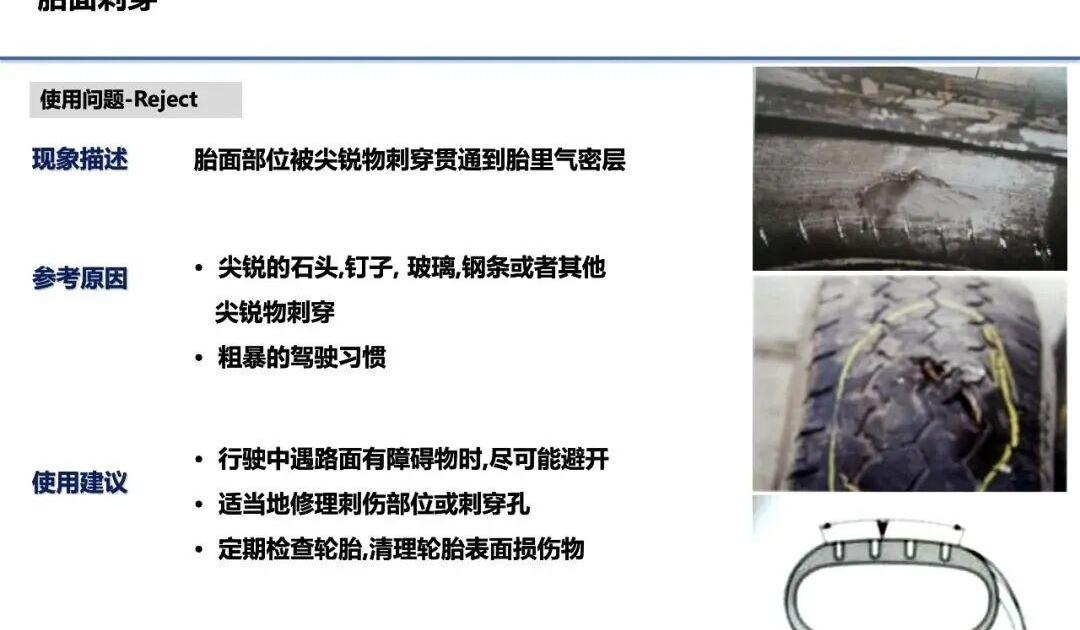
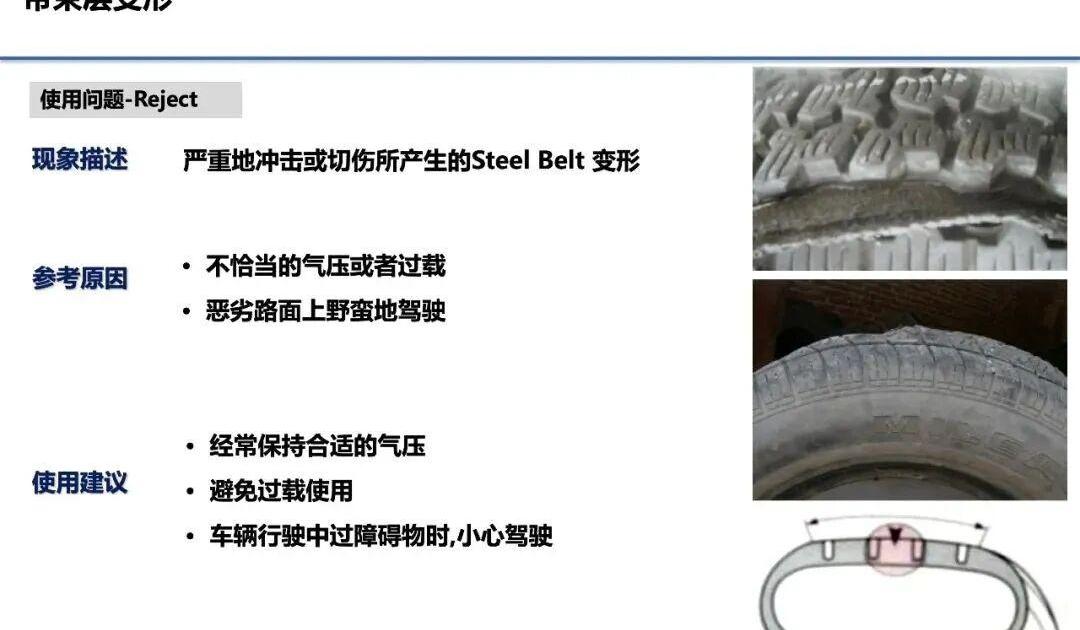
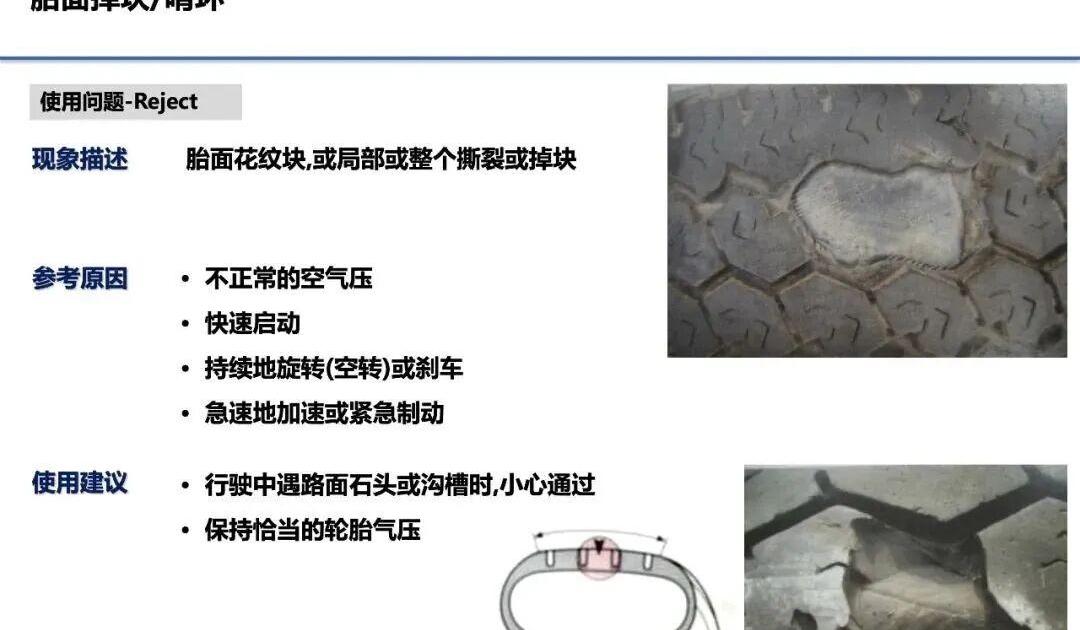
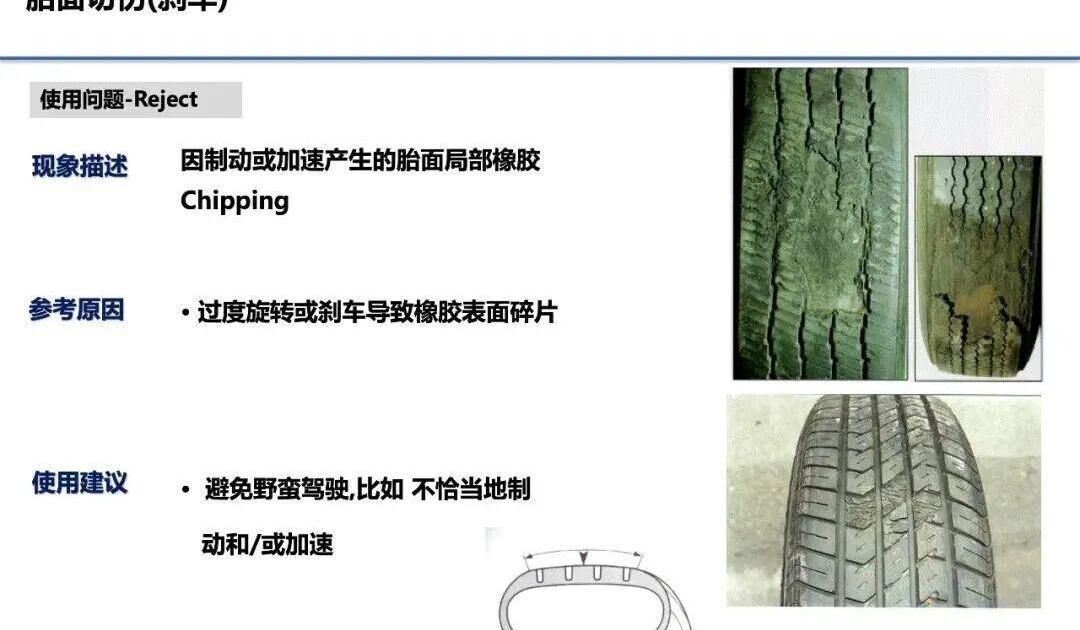
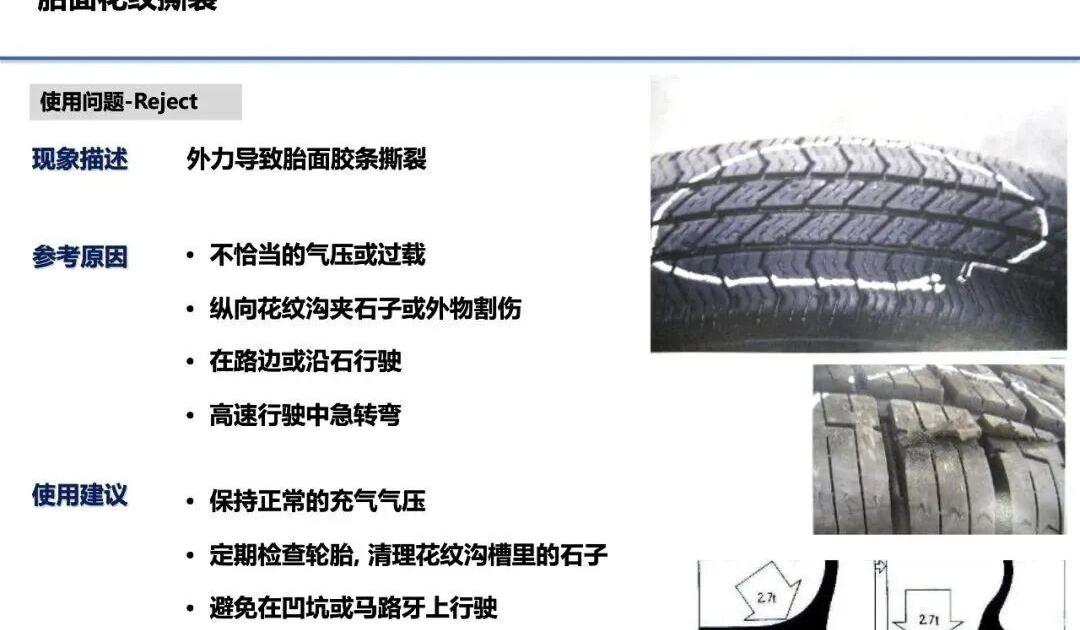
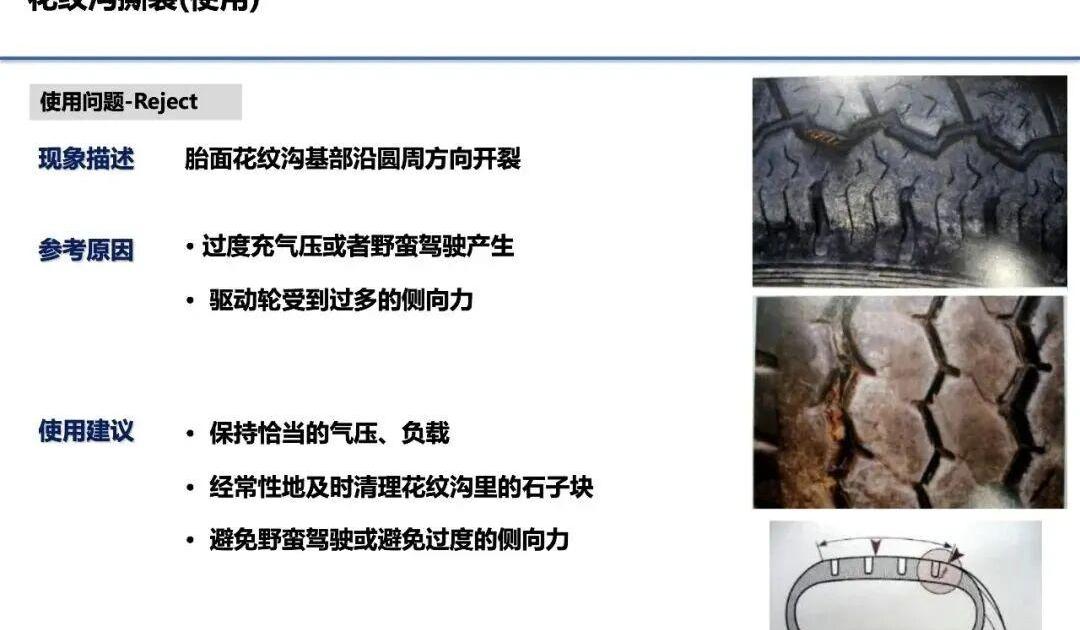
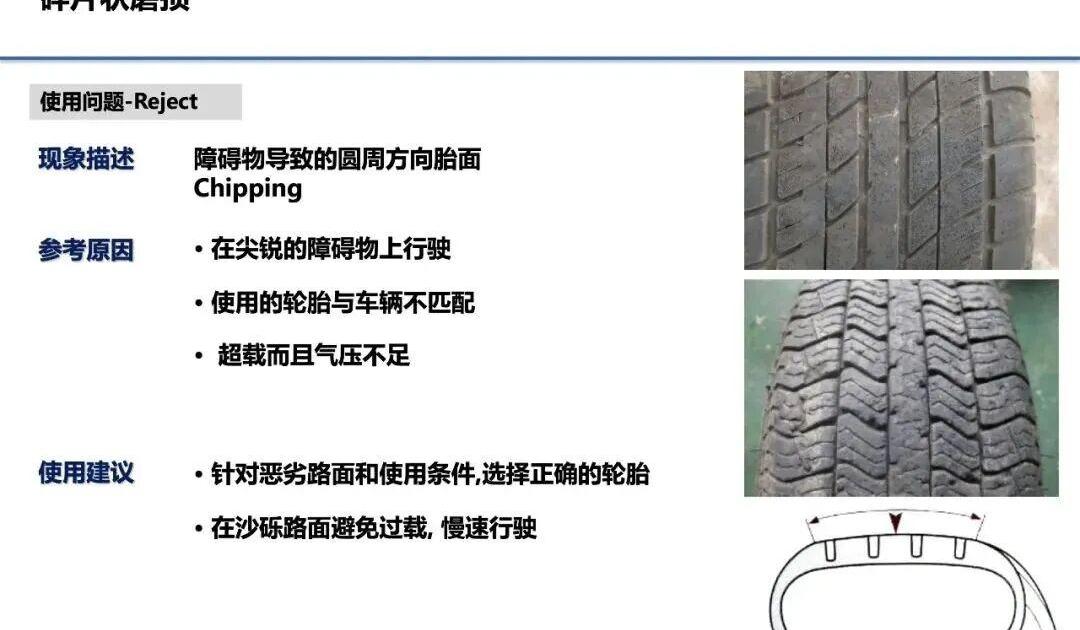
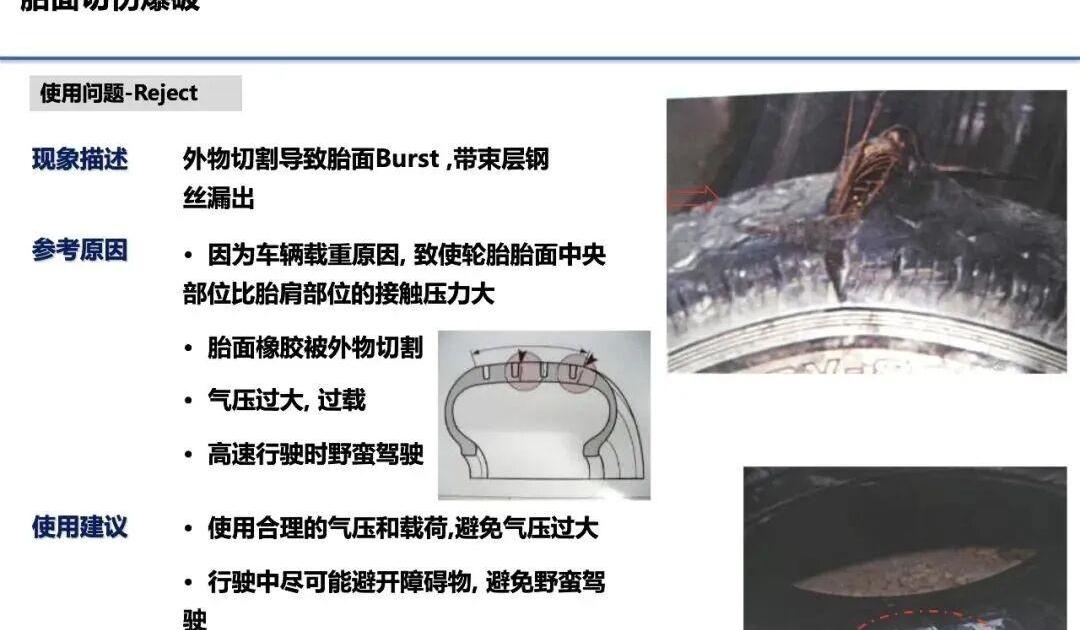
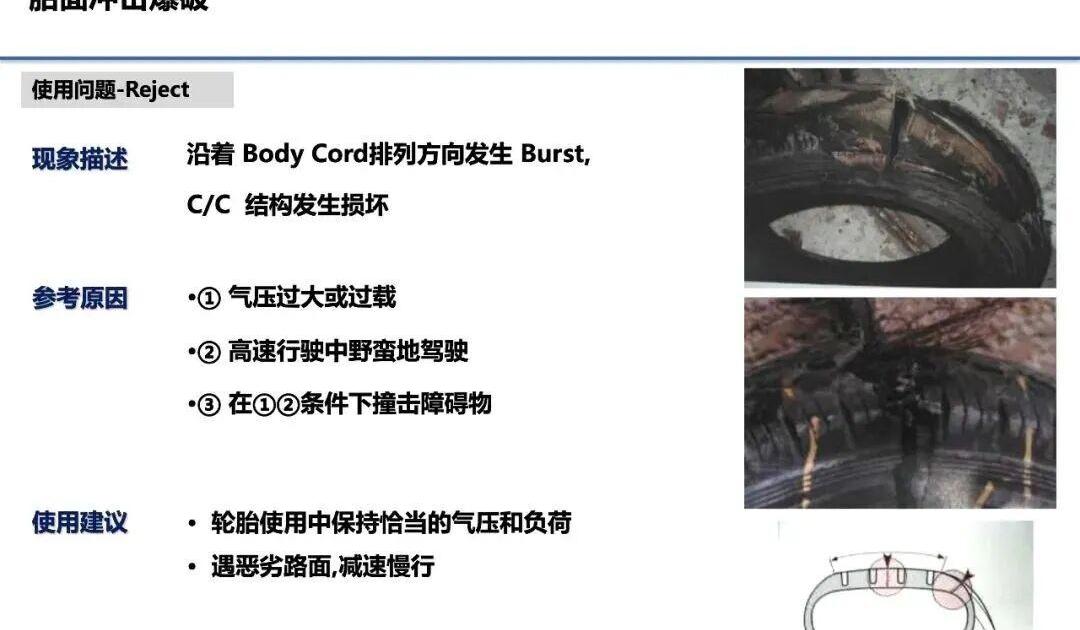
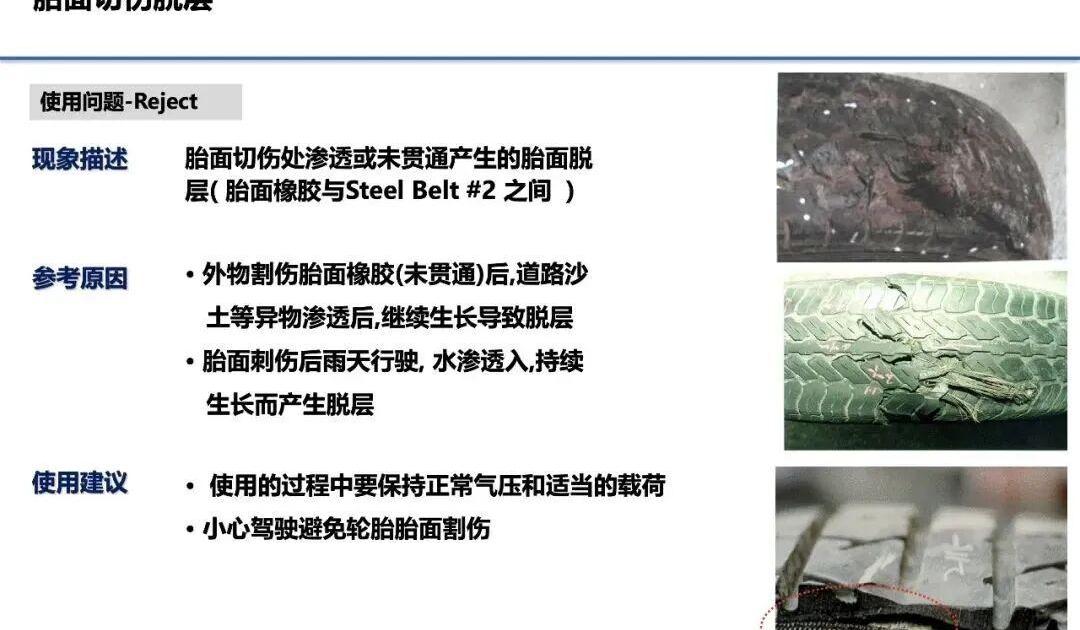
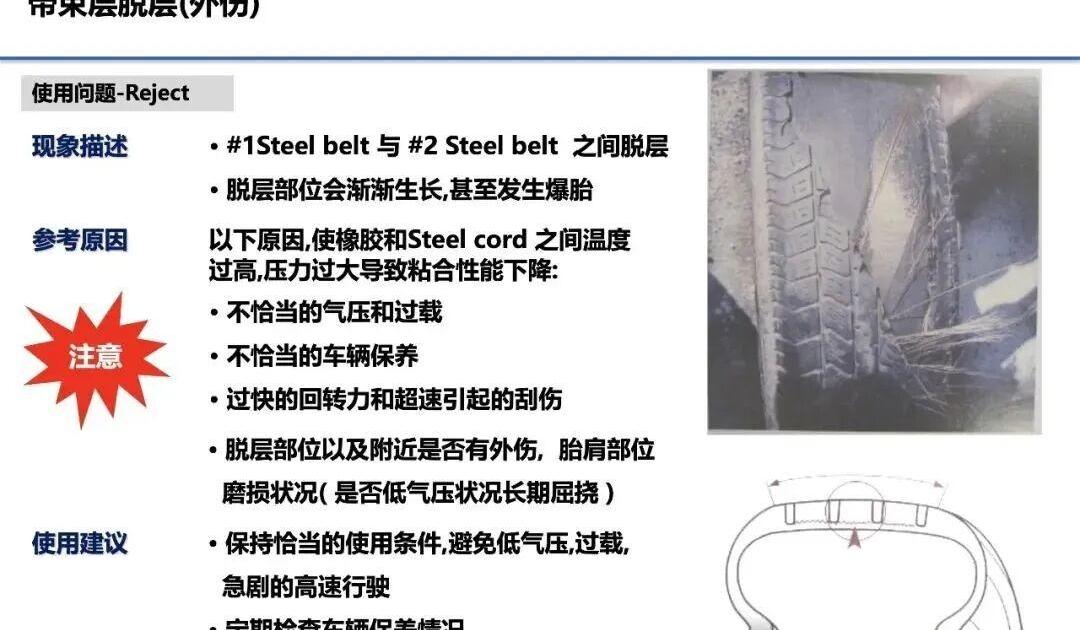
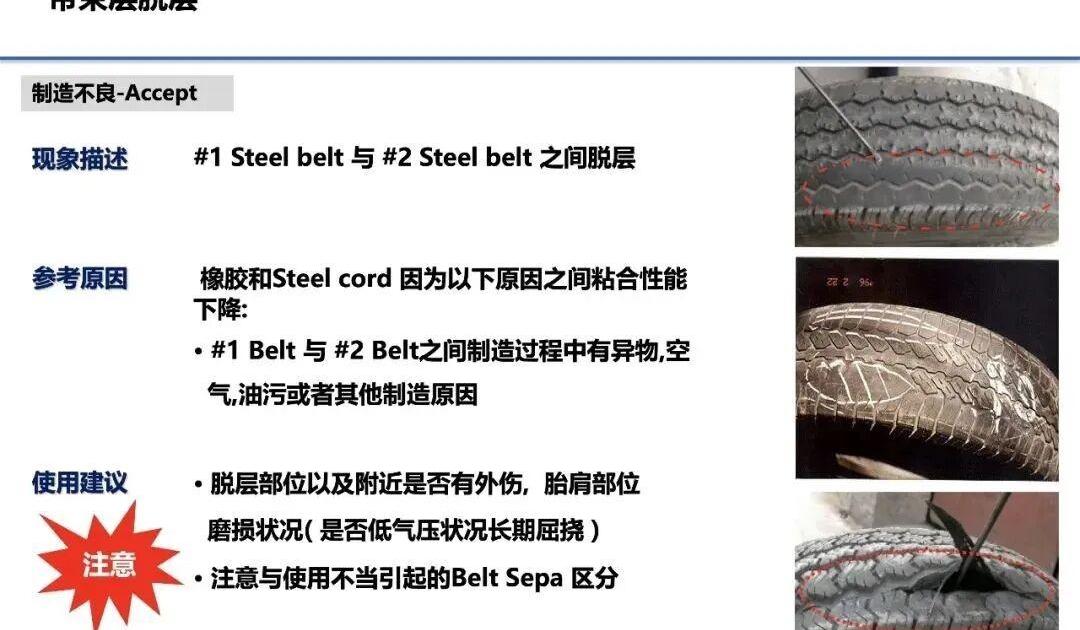
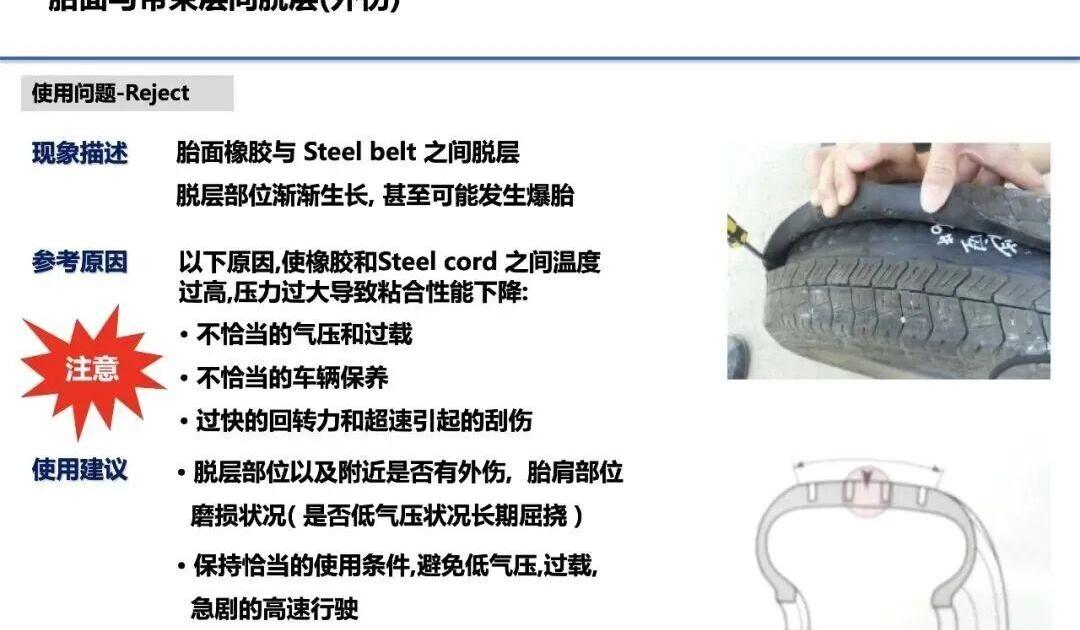
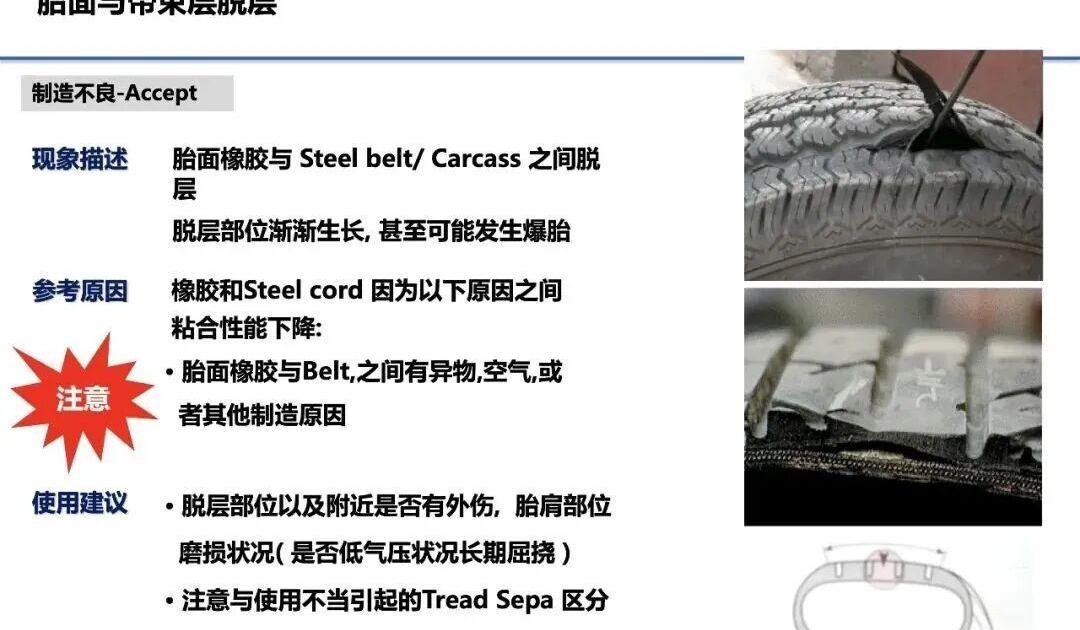
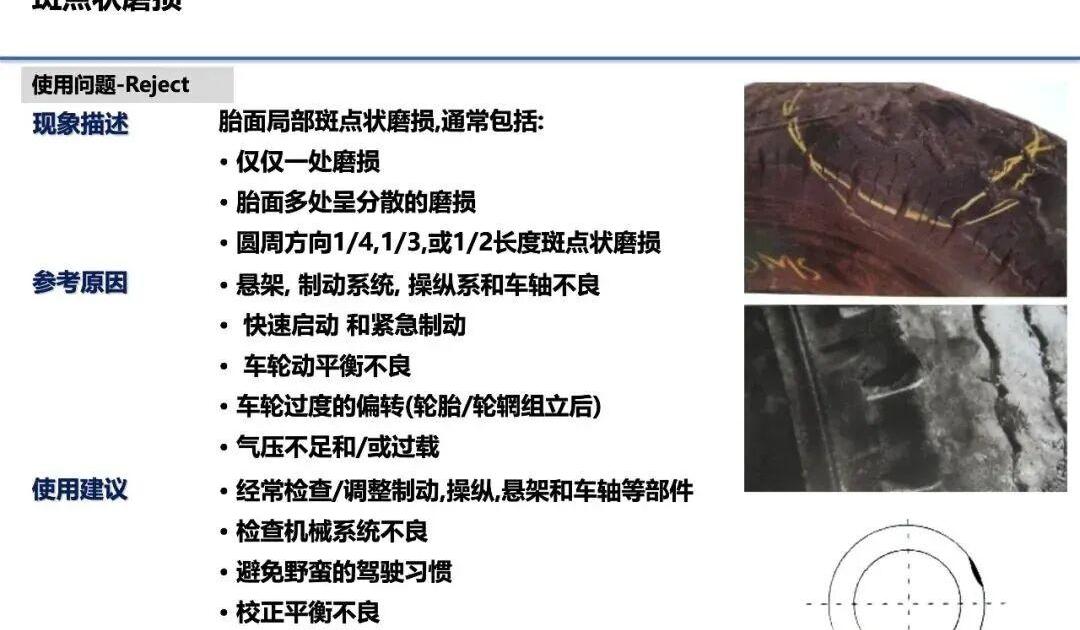
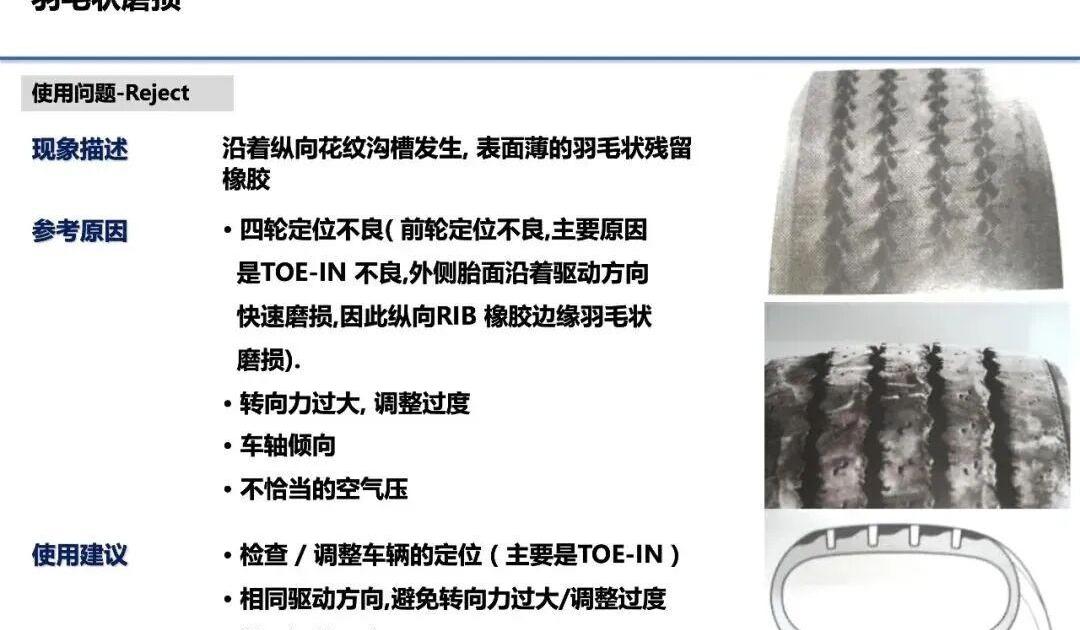
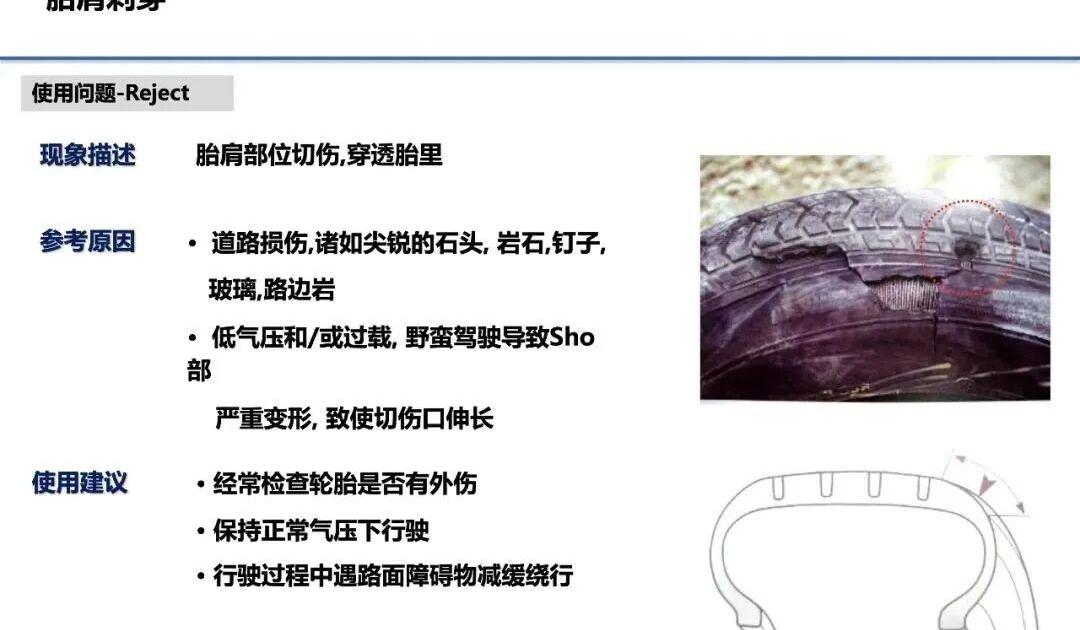
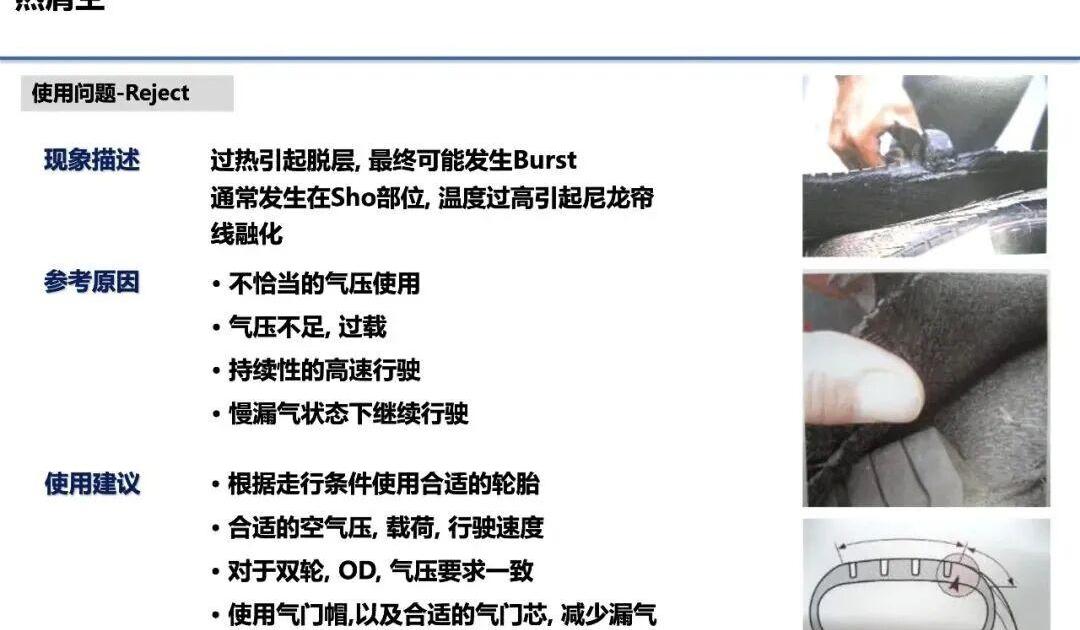
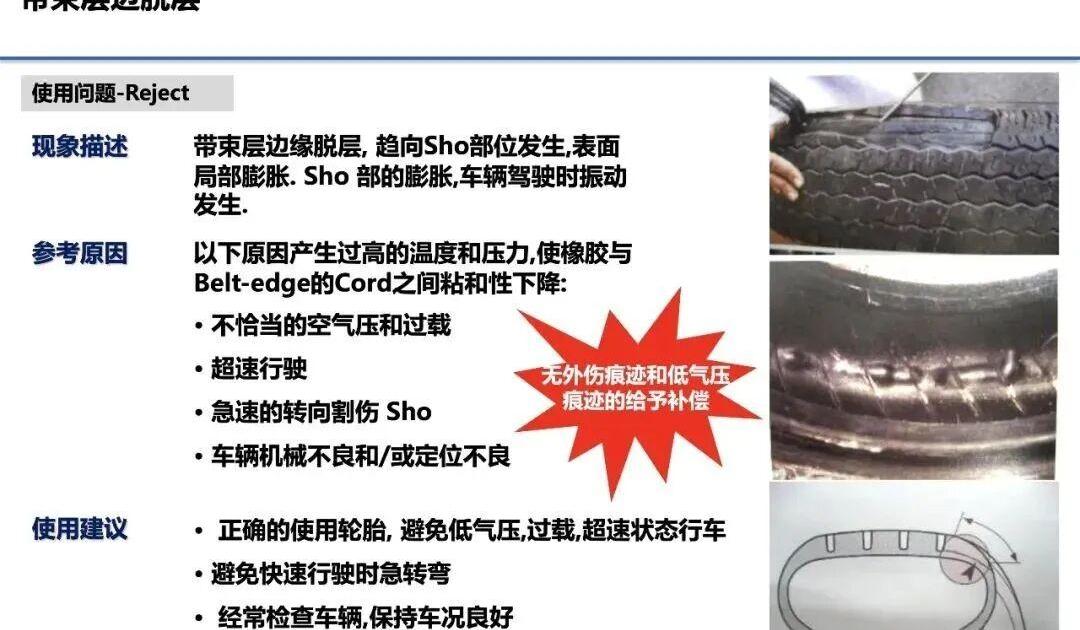
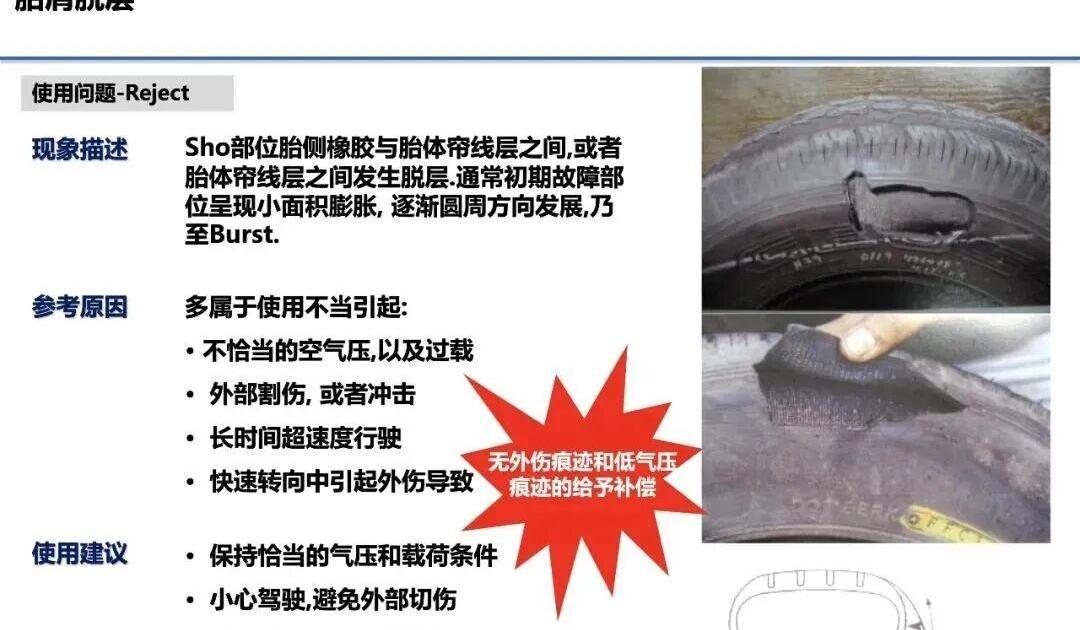
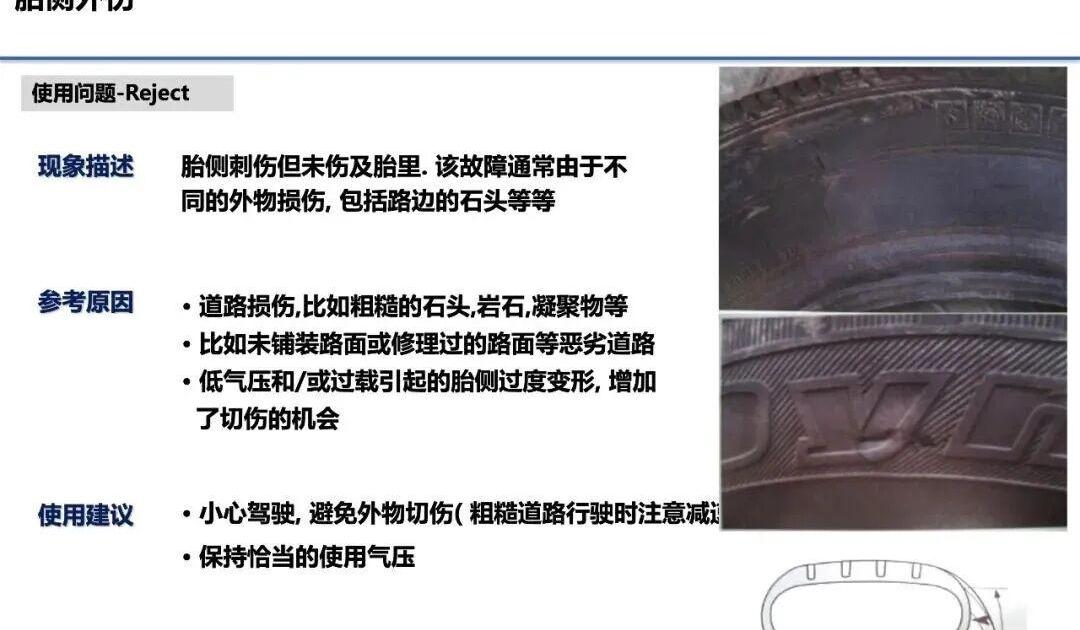
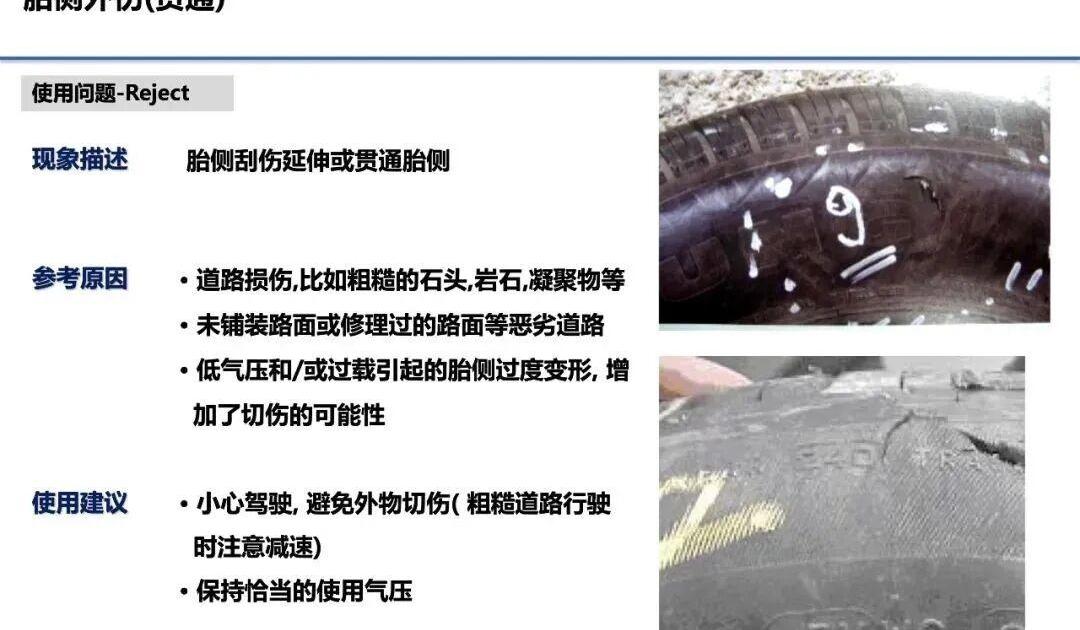
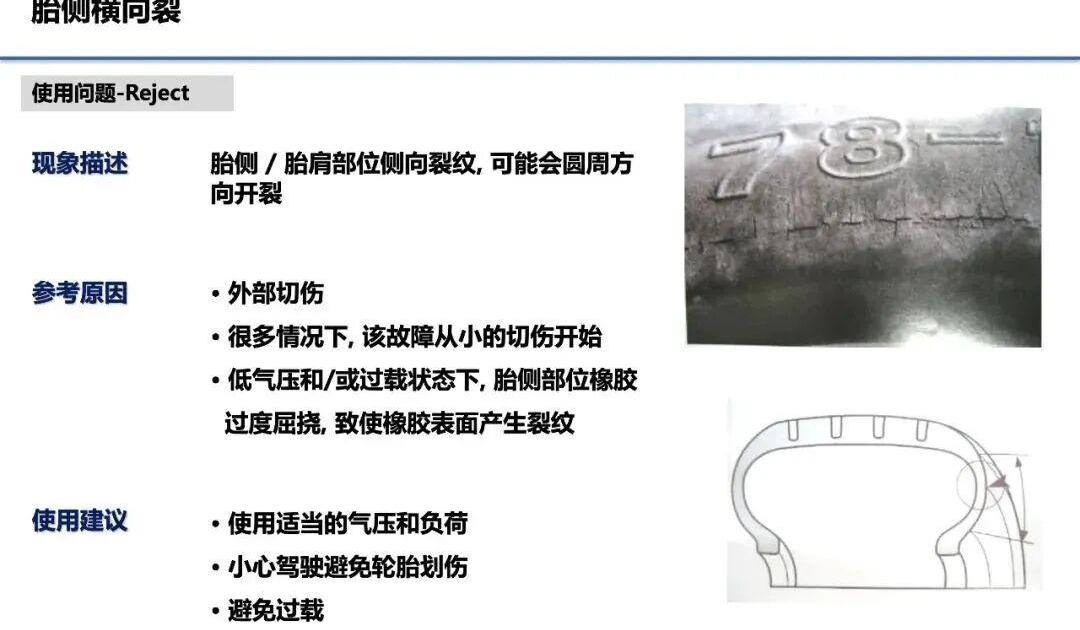
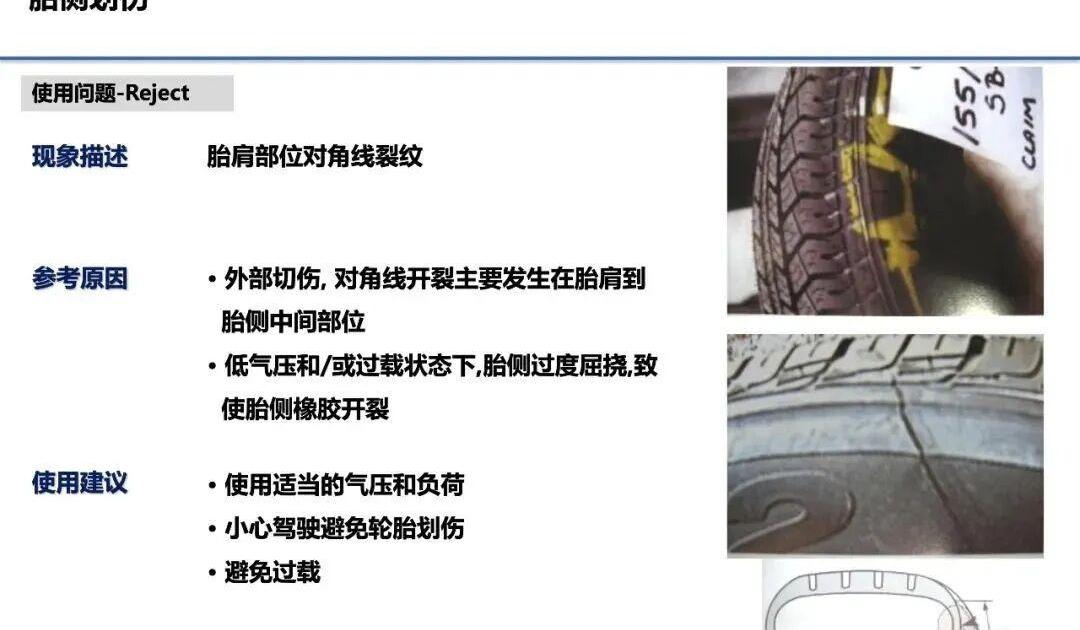
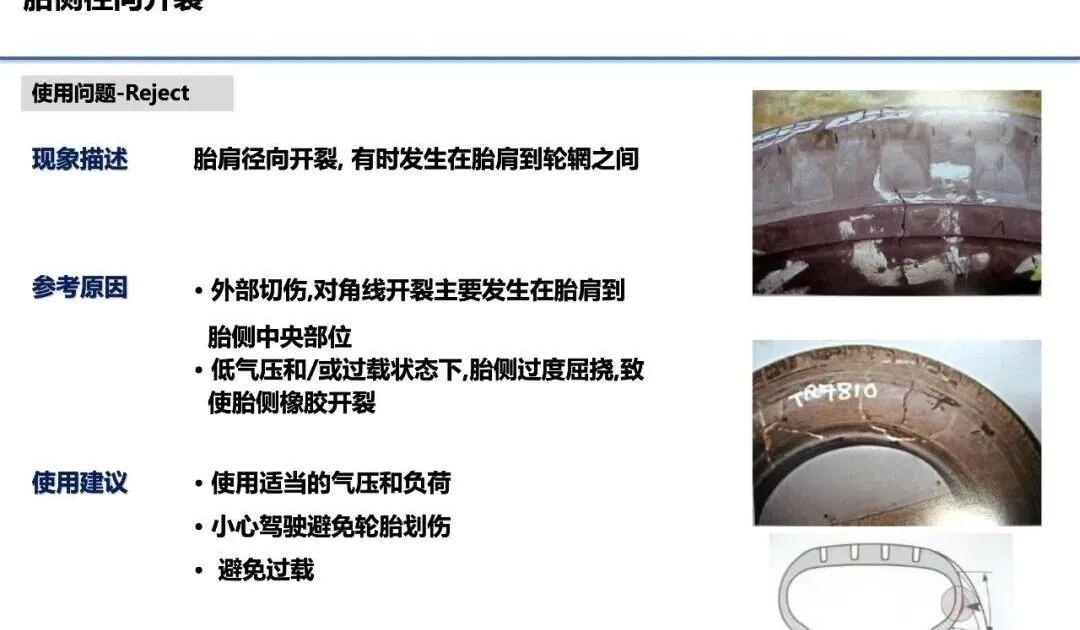
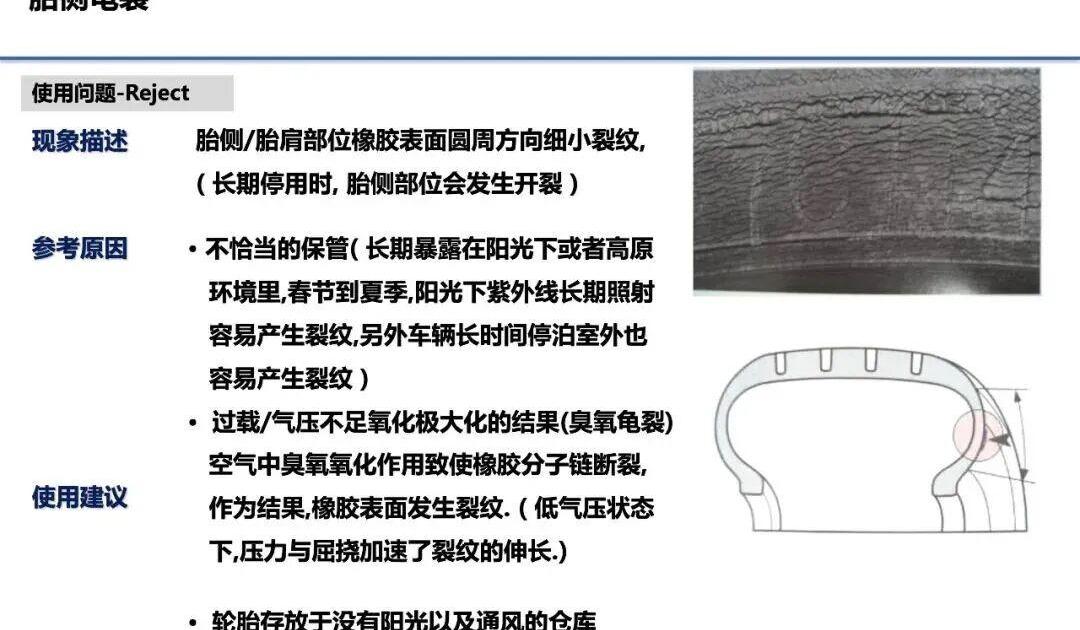
Common Passenger Tire Failure Types, Causes & Prevention
Tires are among the most critical components on a vehicle — they support the entire weight, transmit traction and braking forces, absorb road shocks, and ensure safety, stability, comfort, and fuel economy. Tire condition directly determines driving safety. This guide covers the most common failure types seen in passenger car (semi-steel radial) tires, their root causes, and recommended prevention measures.
Tire Selection: The “Eight Matches” Rule
When replacing original tires, the same axle must have tires that match on all eight points: size, structure, tread wear, ply rating, tread pattern, brand, inflation pressure, and load capacity. Mixing different tires on the same axle causes uneven loading, inconsistent wear, and poor handling — especially dangerous during emergency braking.
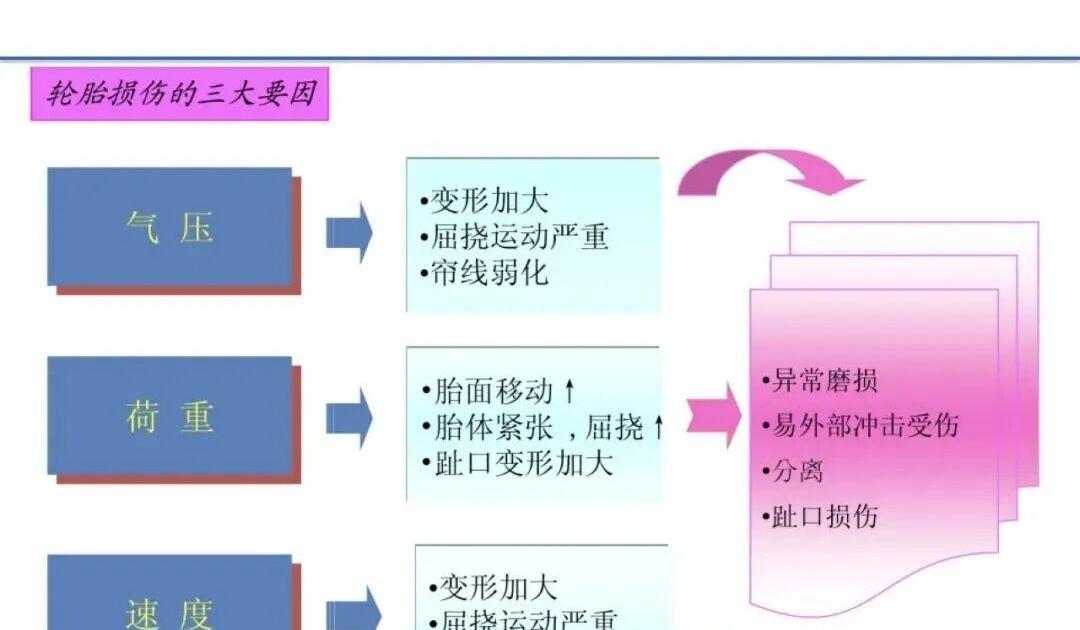
Three Major Causes of Tire Damage
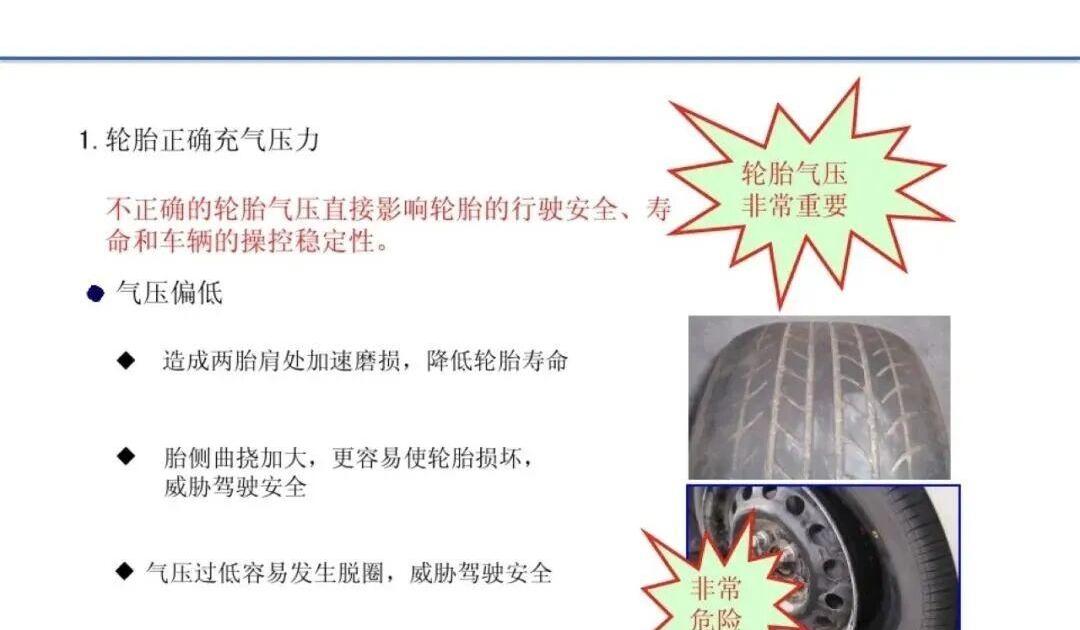
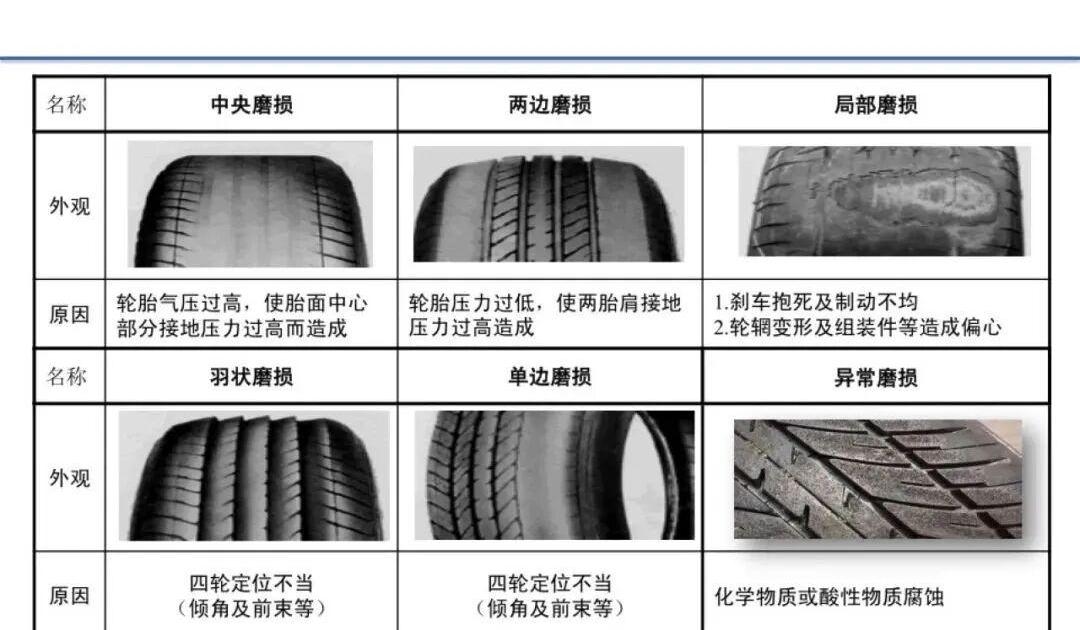
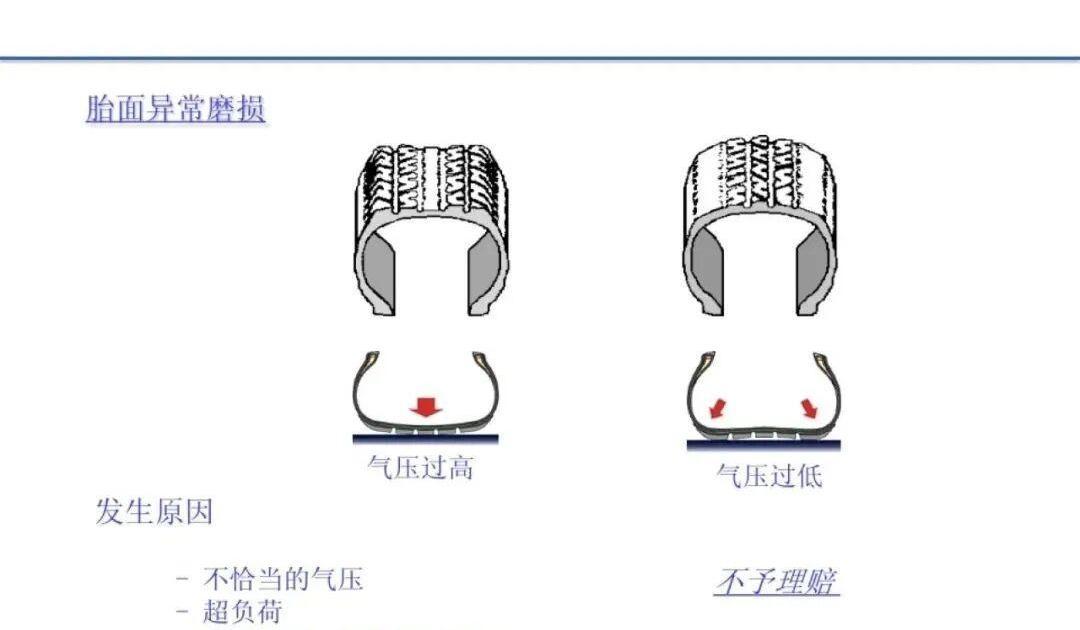
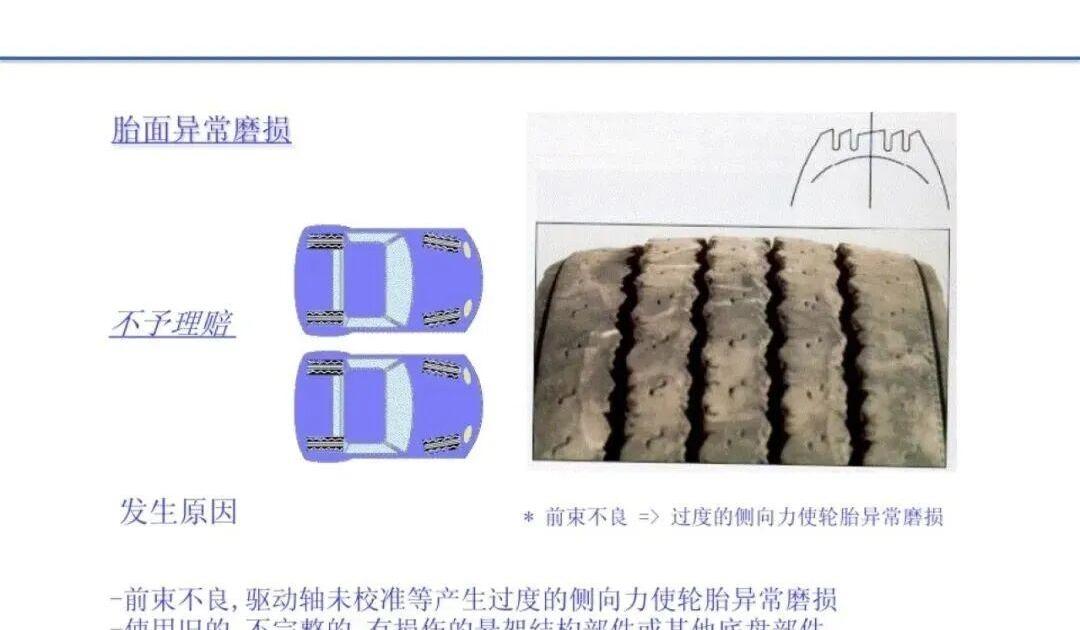
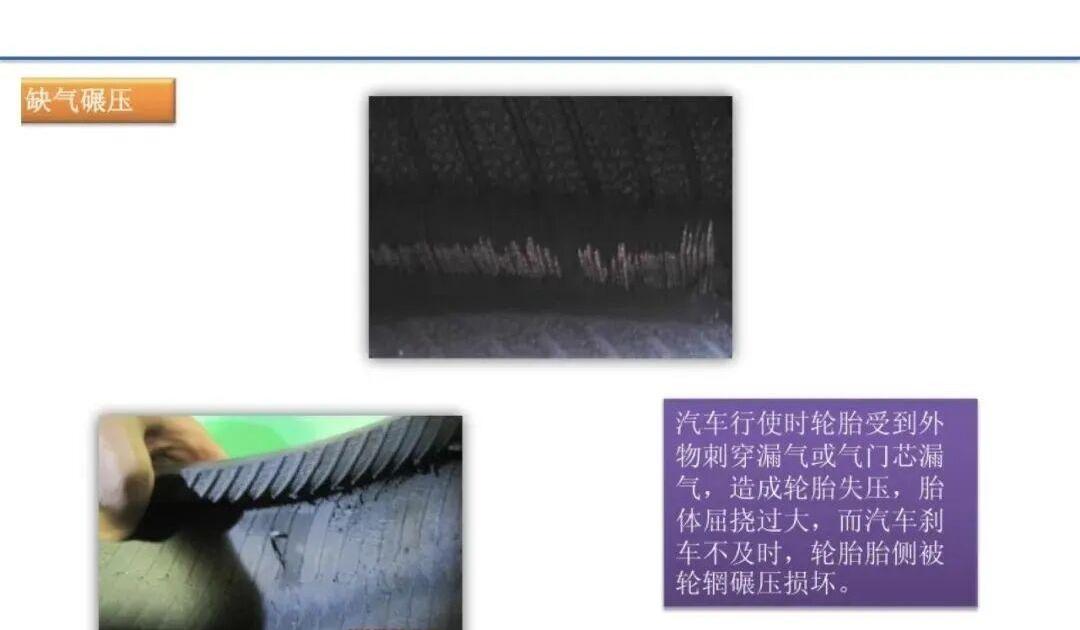
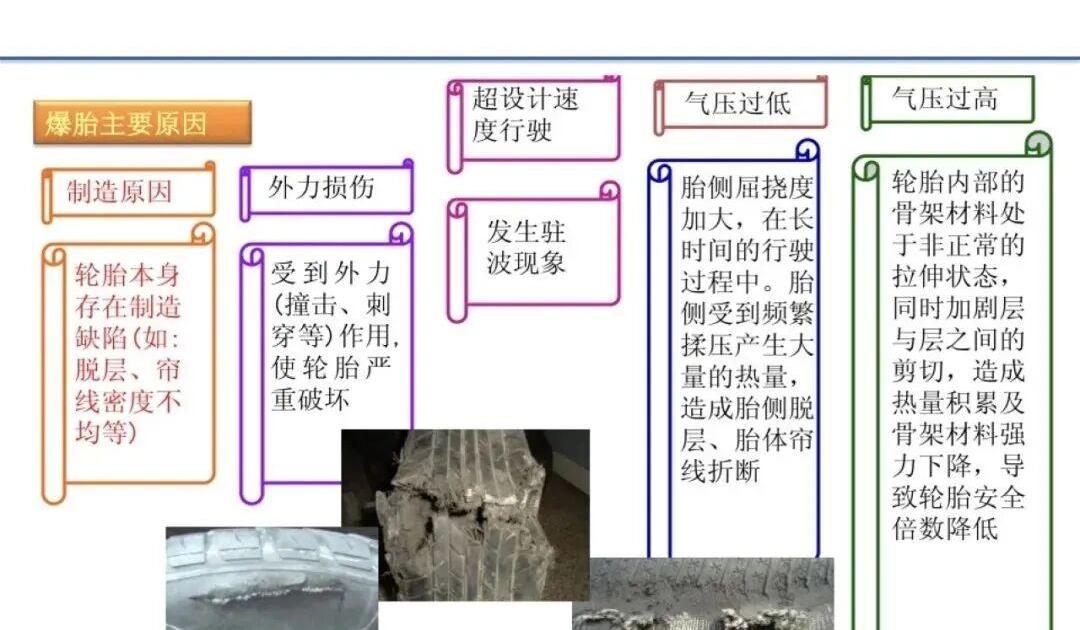
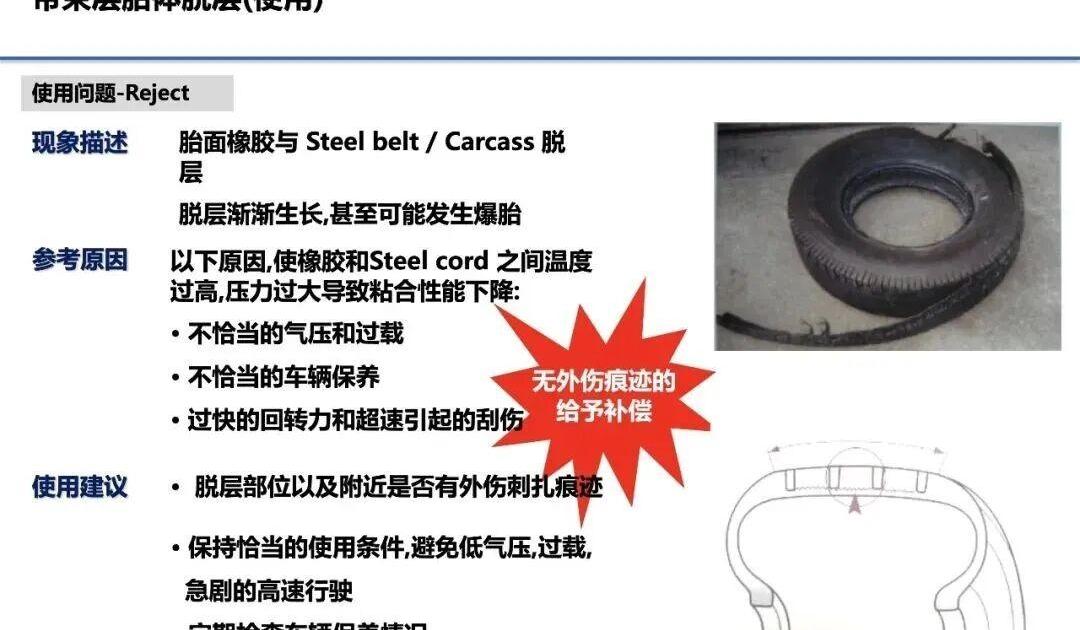
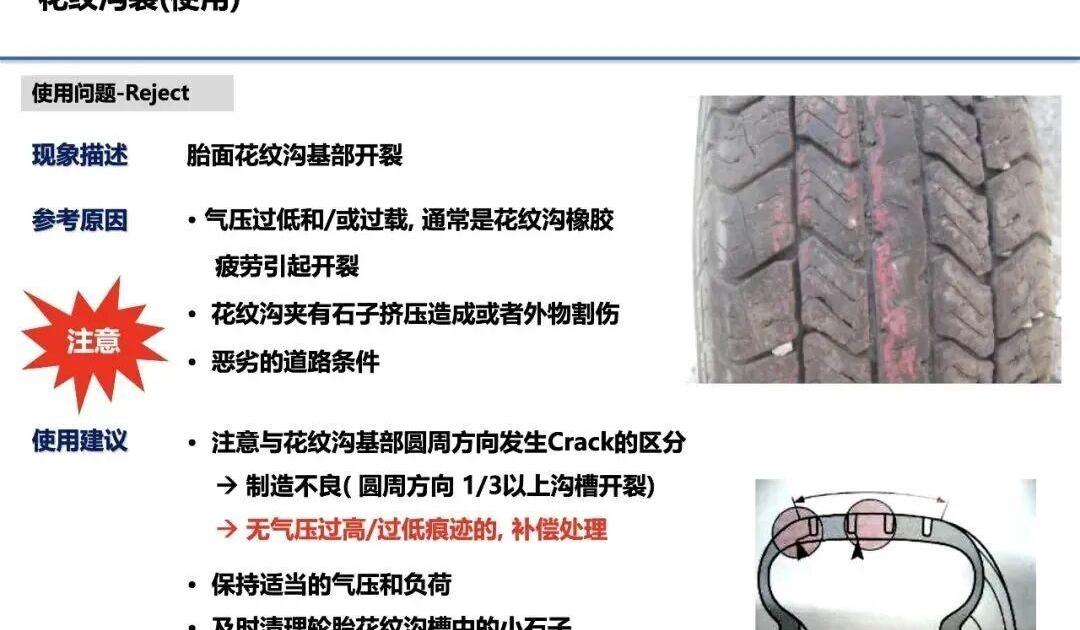
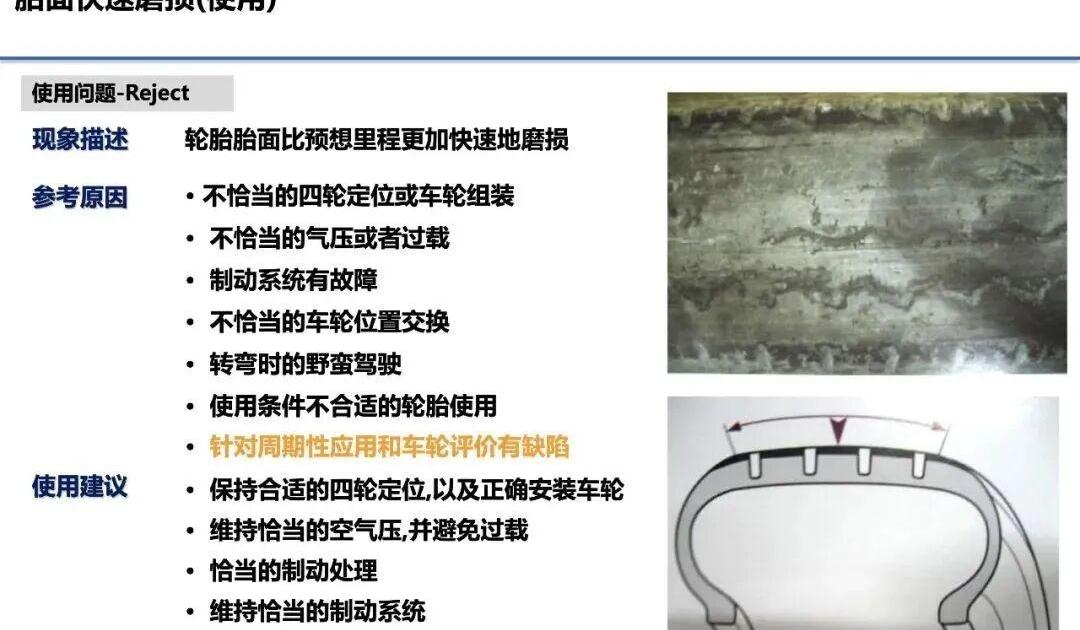
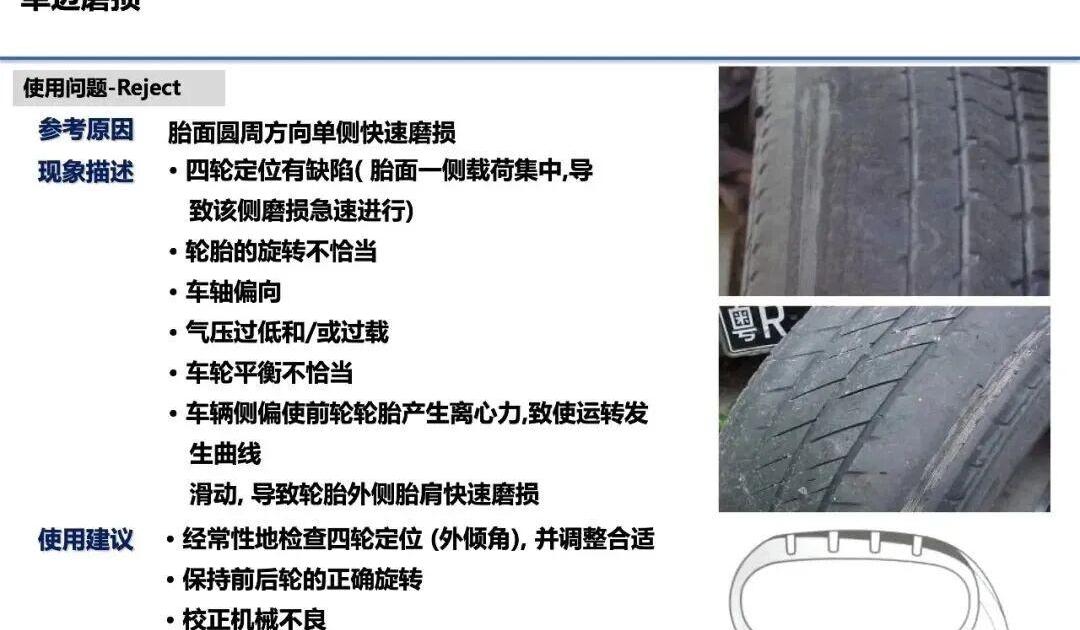
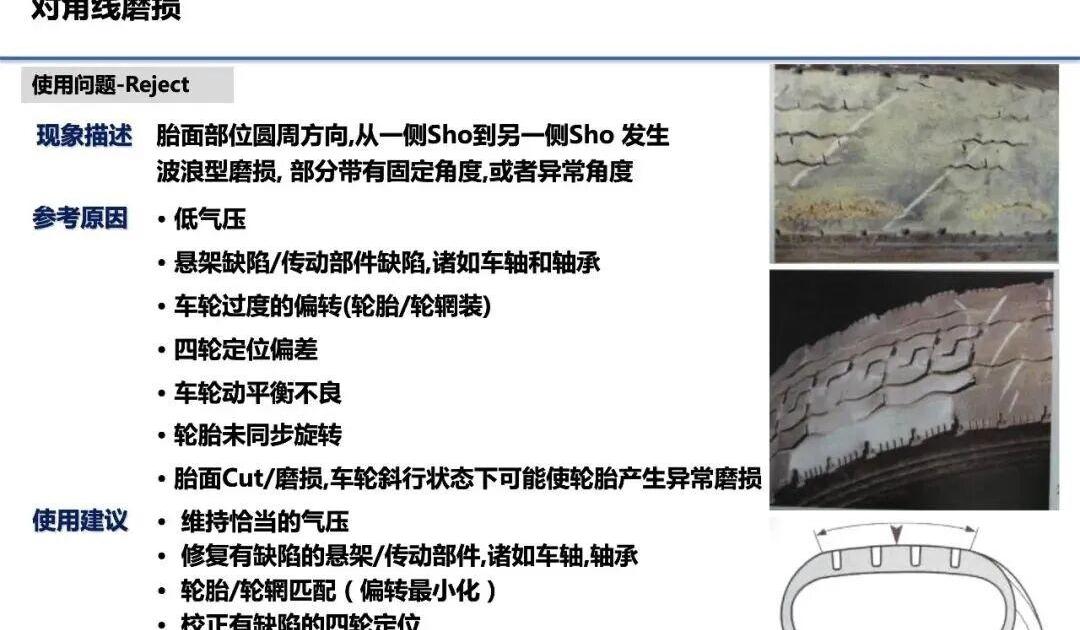
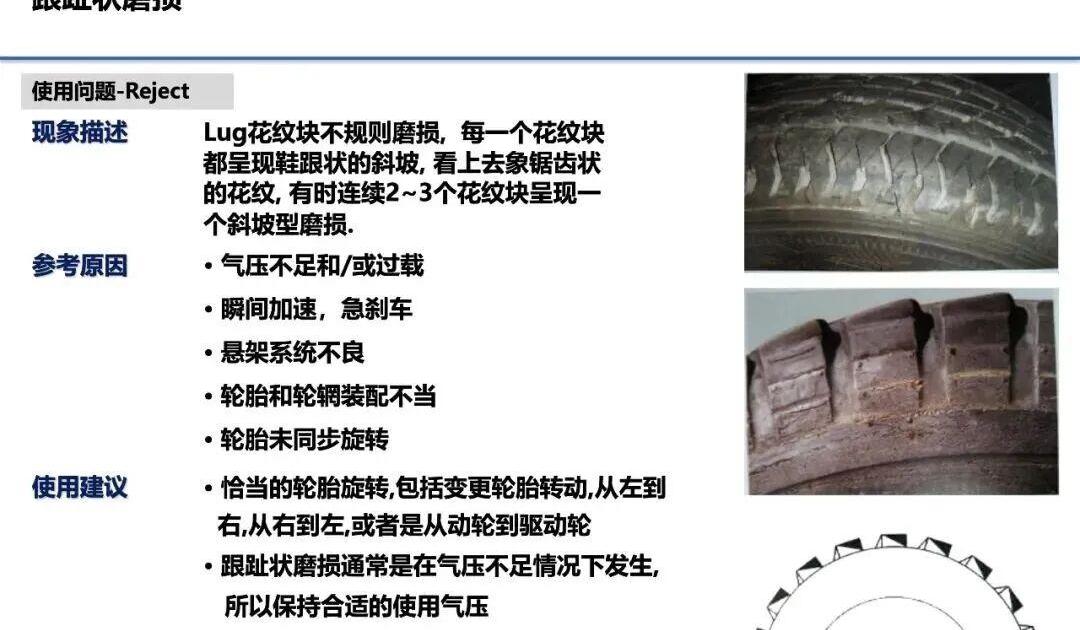
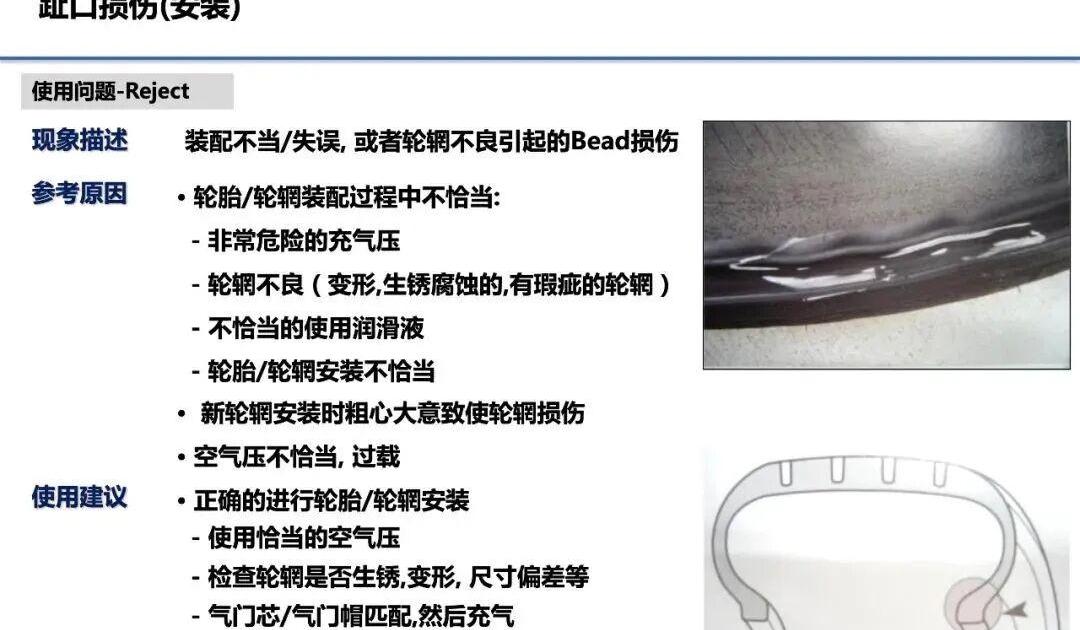
Inflation pressure: Under-inflation causes excessive deformation, severe flexing, and cord weakening → abnormal shoulder wear, separation, and bead damage.
Load: Overloading shifts tread contact, stresses the carcass, and deforms the bead → impact damage and separation.
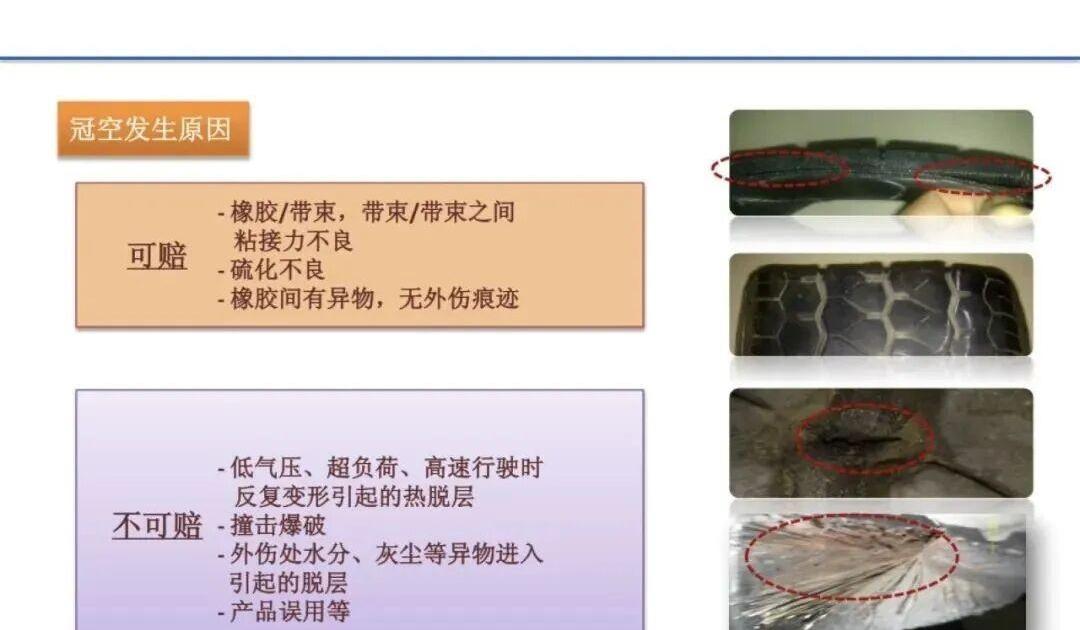
Speed: High speed amplifies deformation and flexing heat buildup → cord weakening and structural failure.
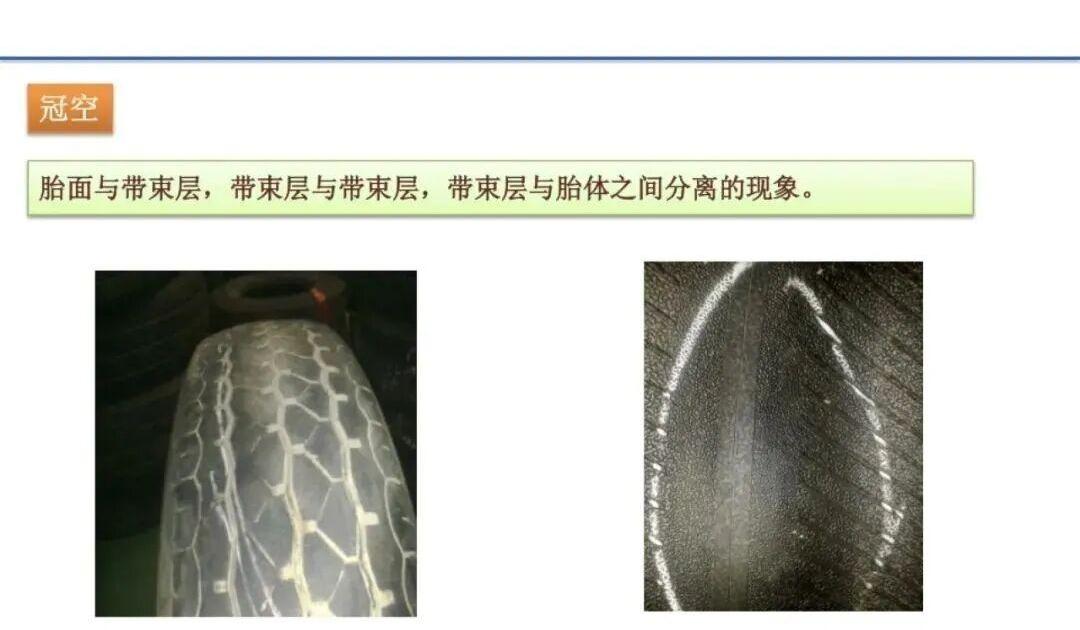
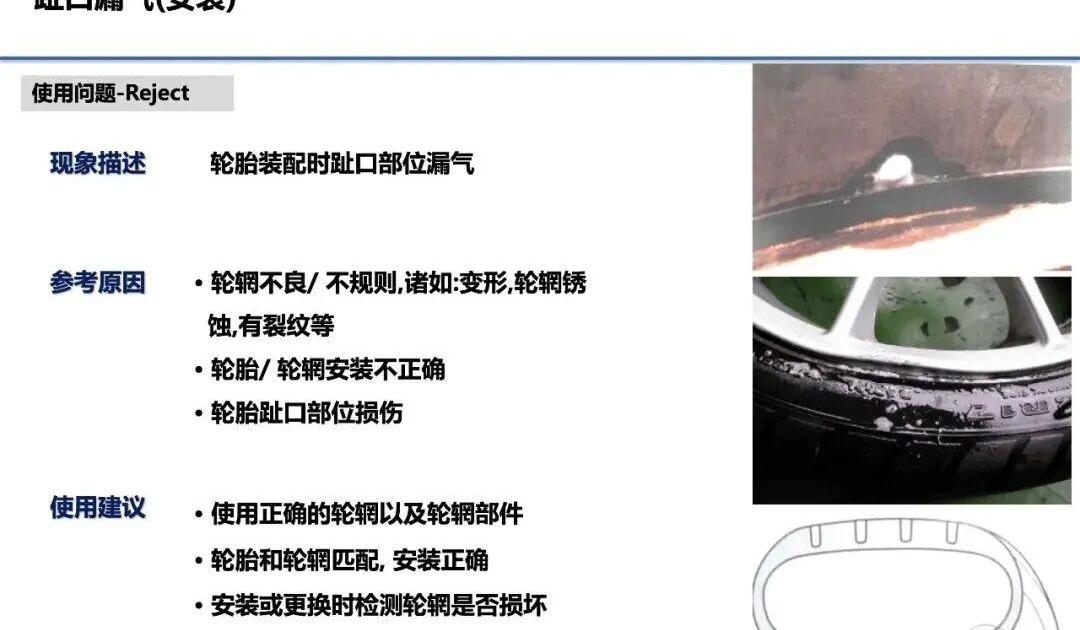
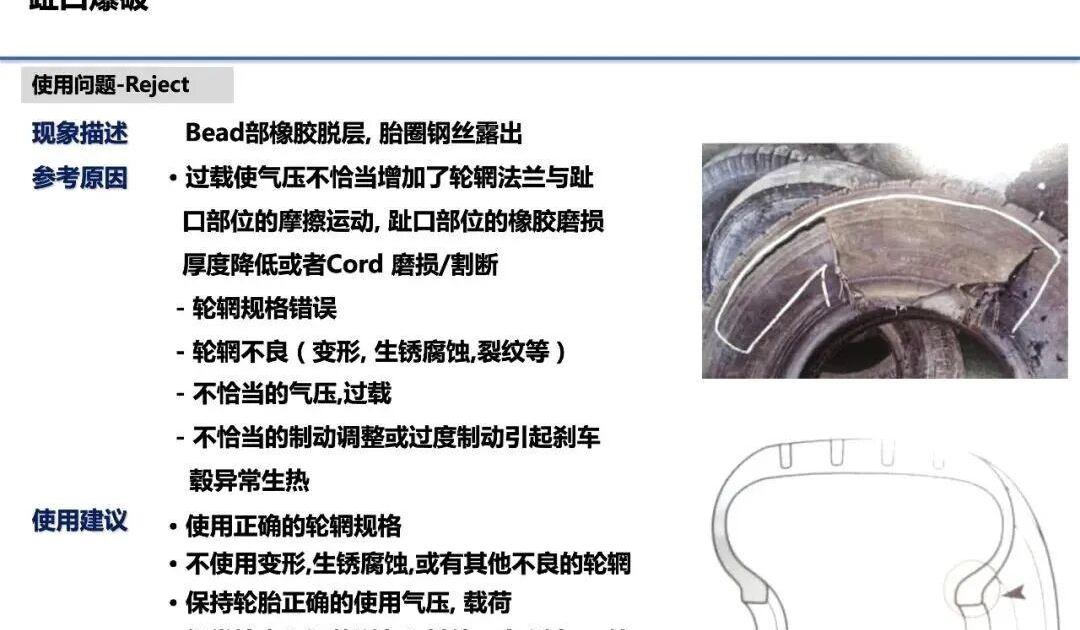
These three factors lead to four common failure outcomes: abnormal wear, impact damage, separation, and bead damage.
Inflation Pressure Matters
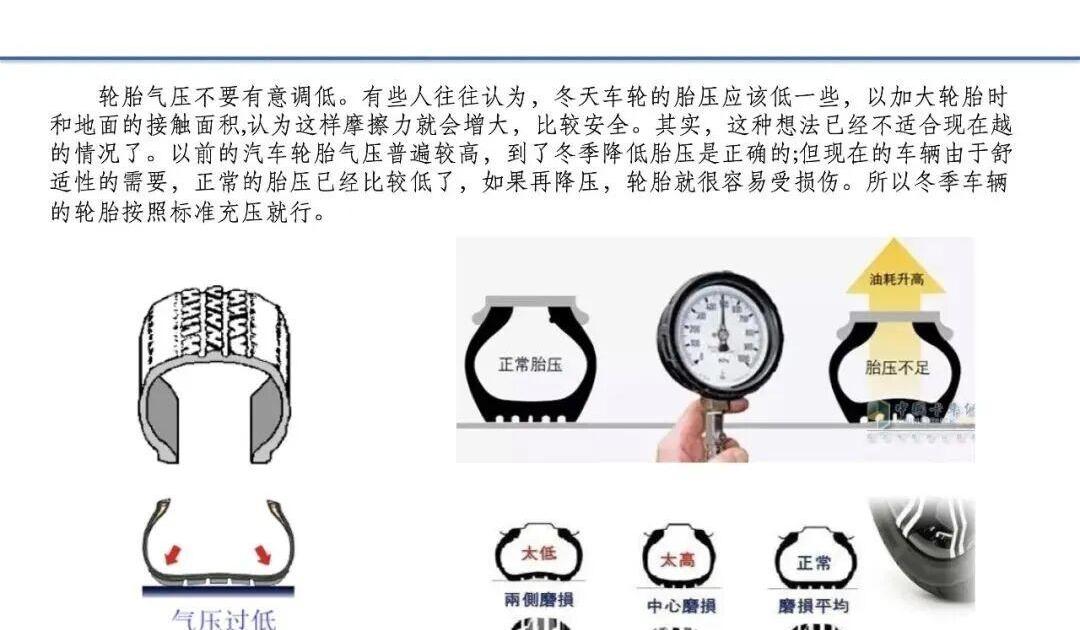
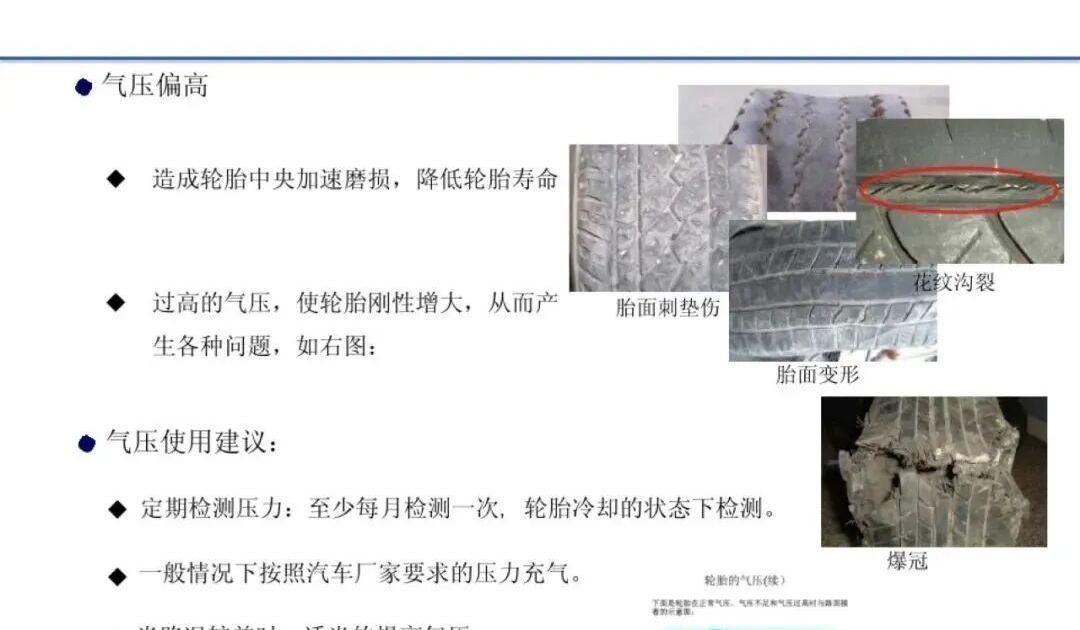
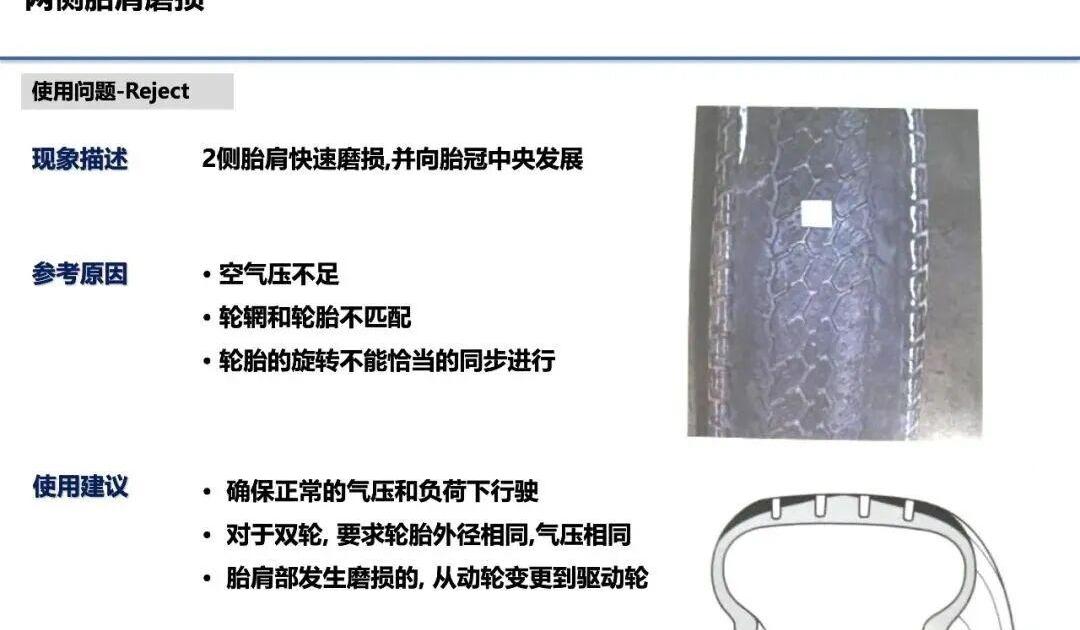
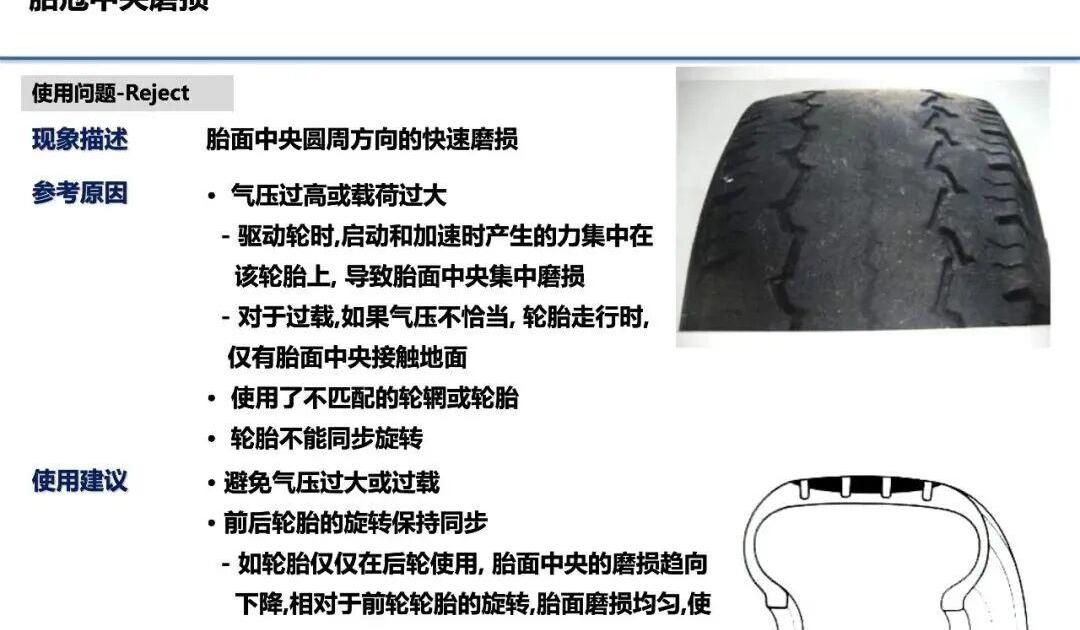
Never intentionally run lower tire pressure in winter. Modern vehicles already run relatively low recommended pressures for comfort; further reducing pressure makes tires prone to damage. Under-inflation causes shoulder wear and higher fuel consumption; over-inflation causes center wear. Always inflate to the vehicle manufacturer’s recommended pressure.
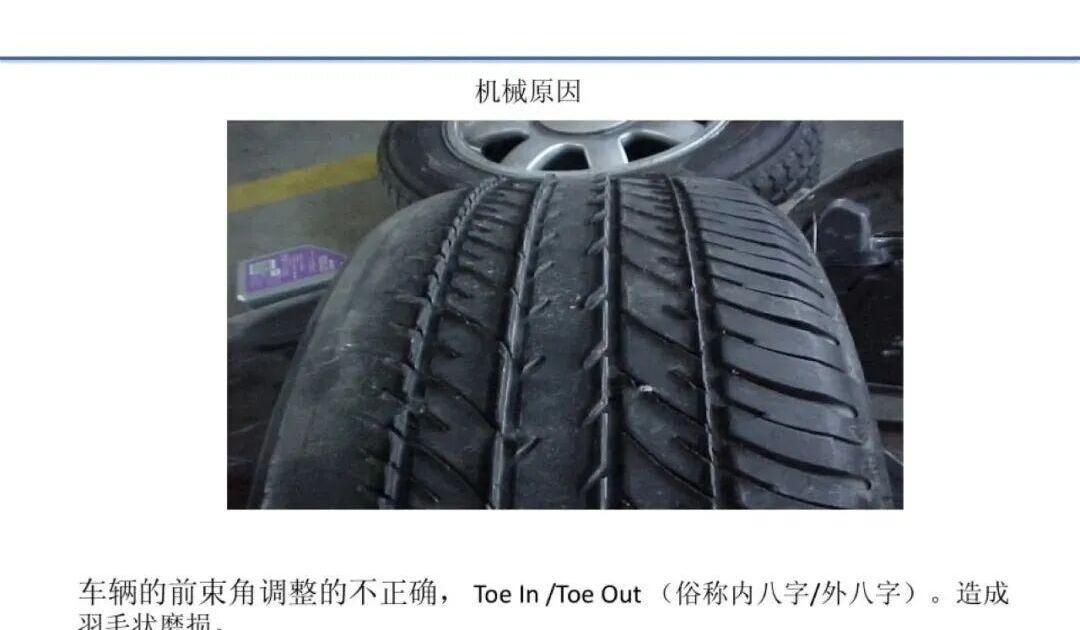
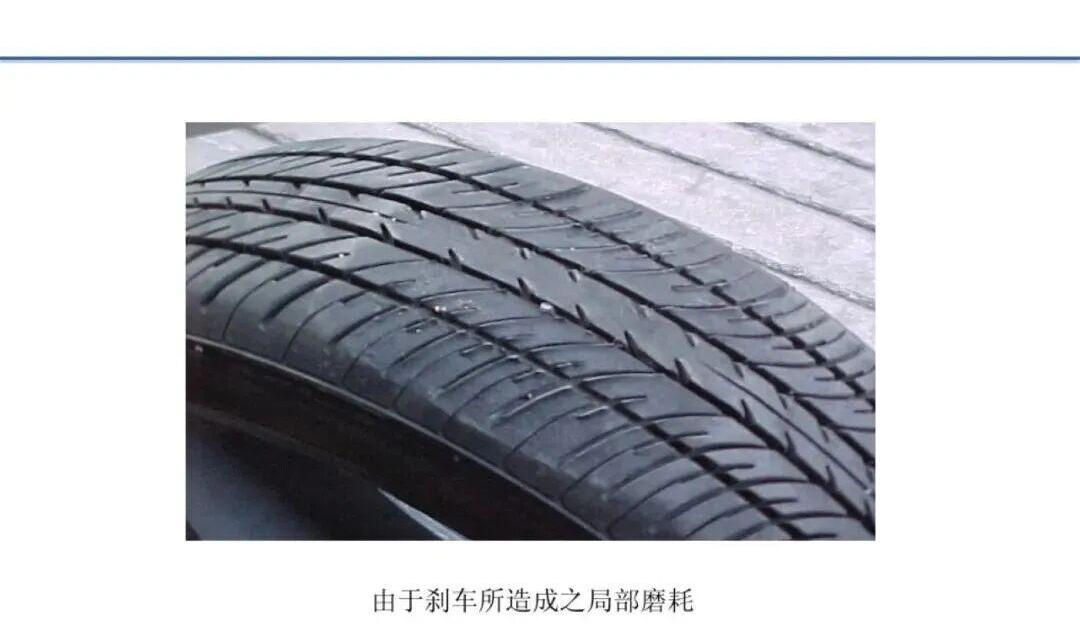
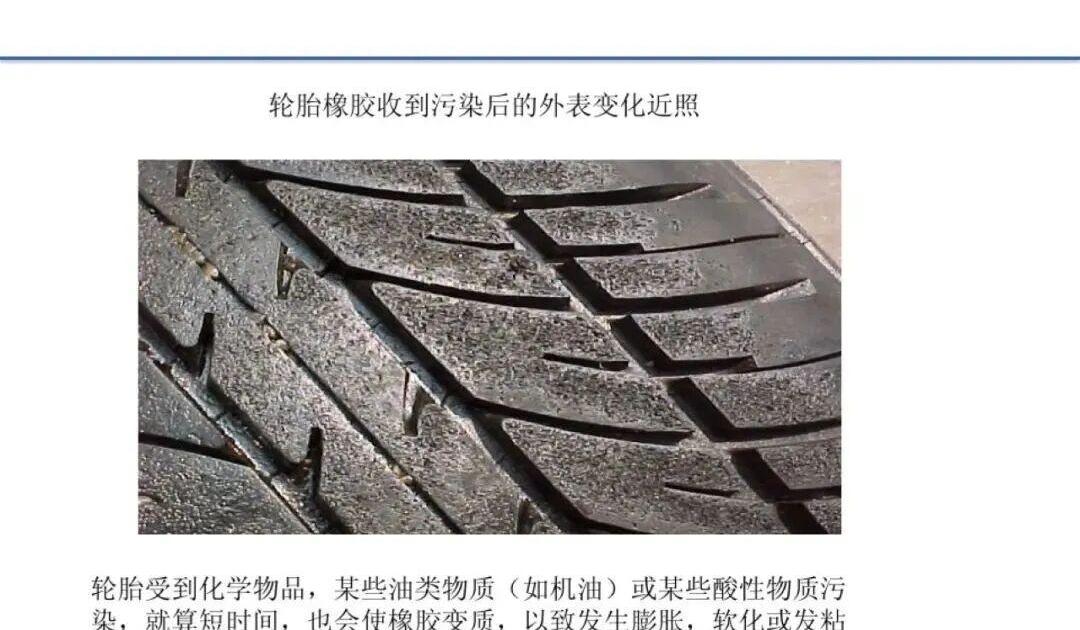
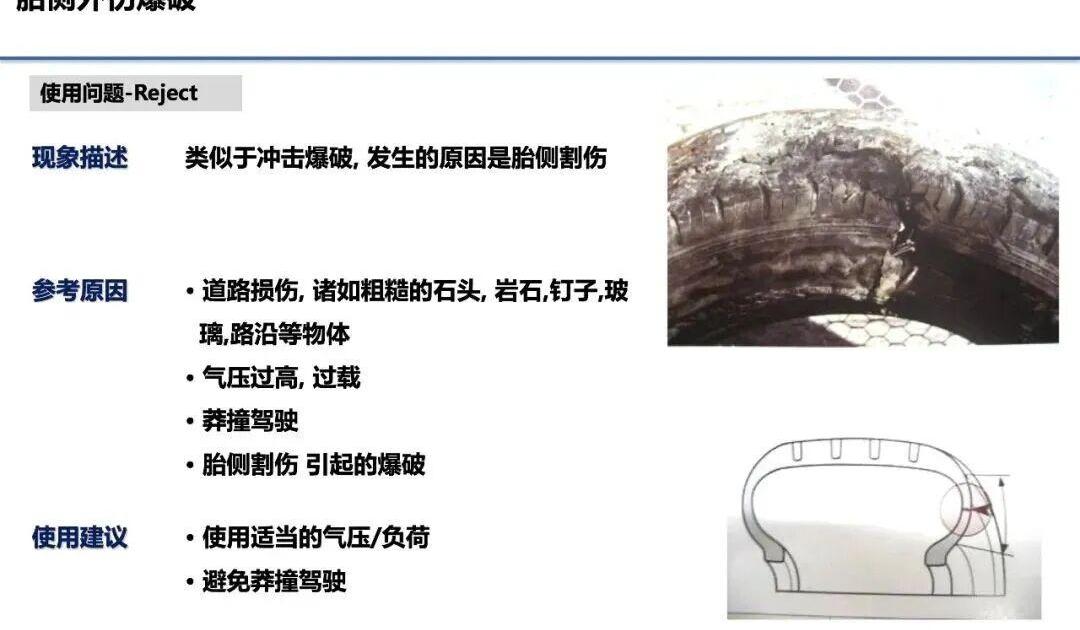
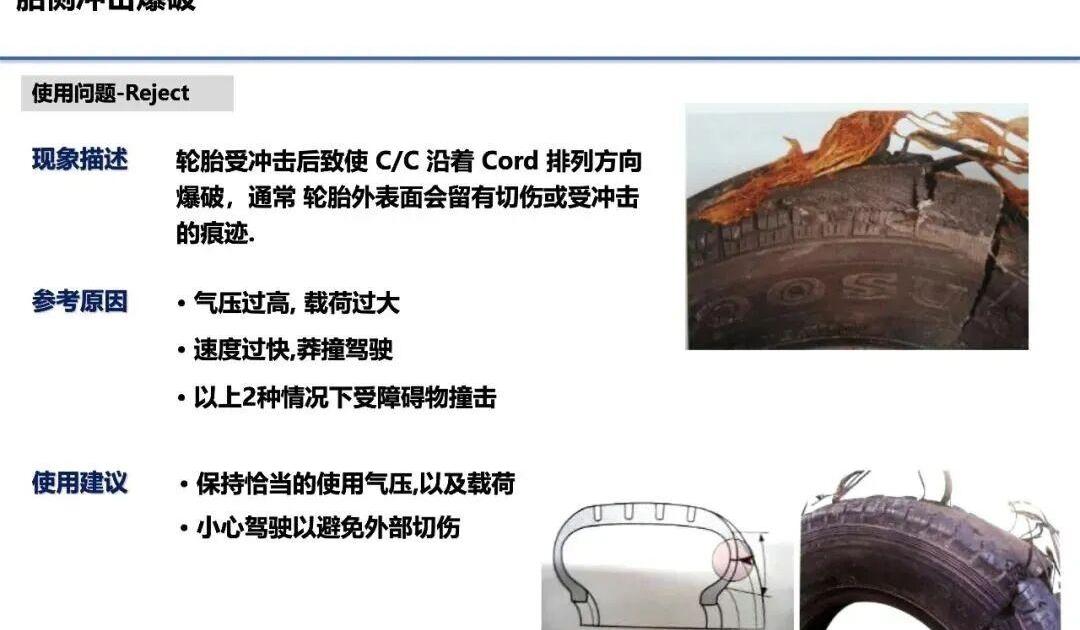
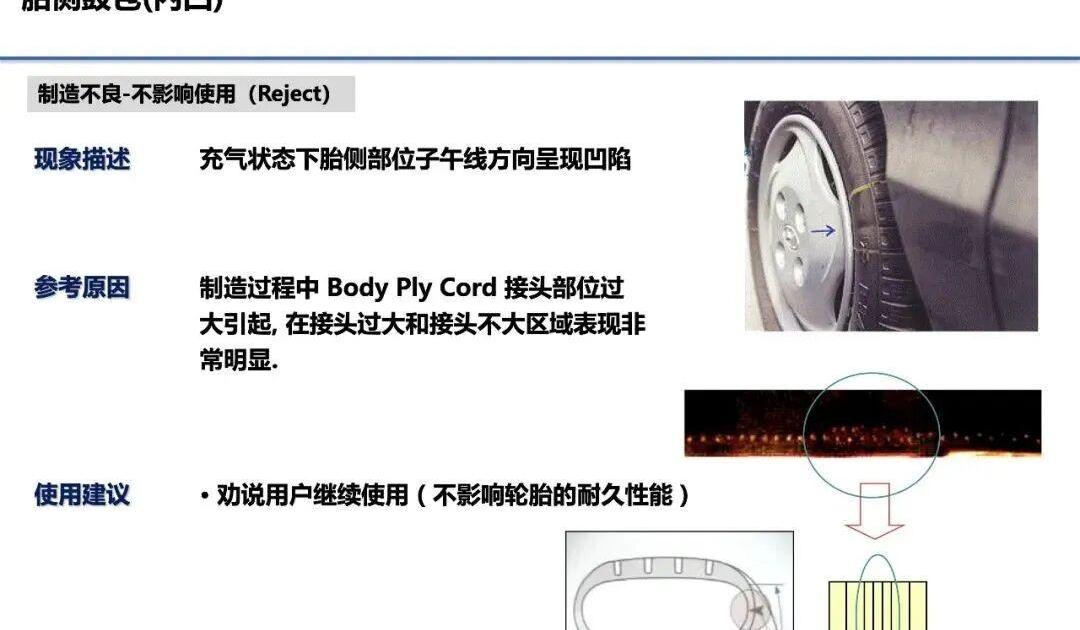
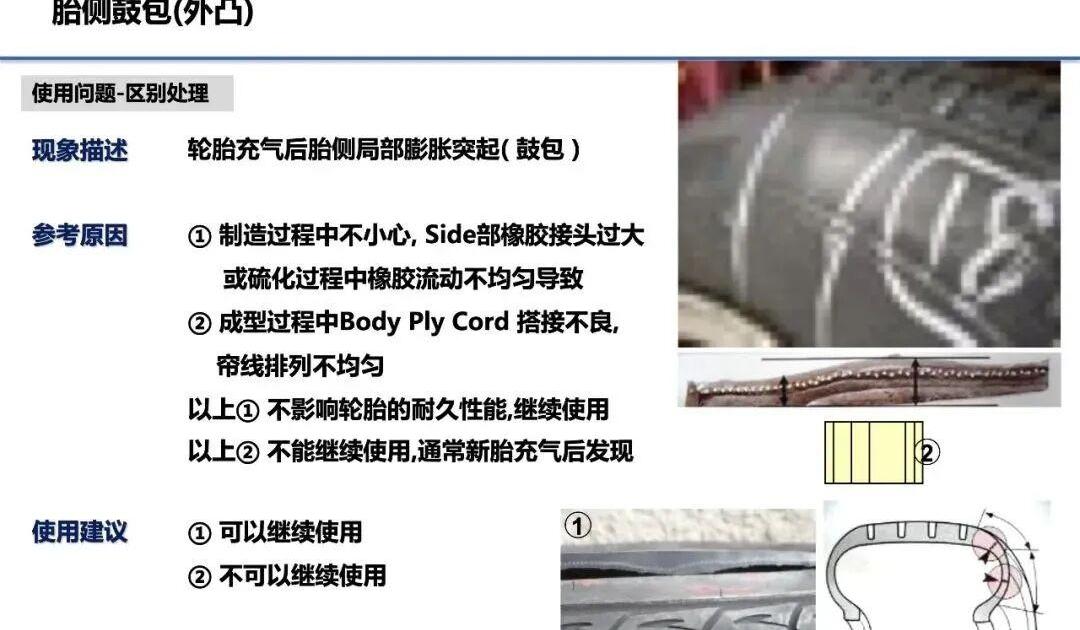
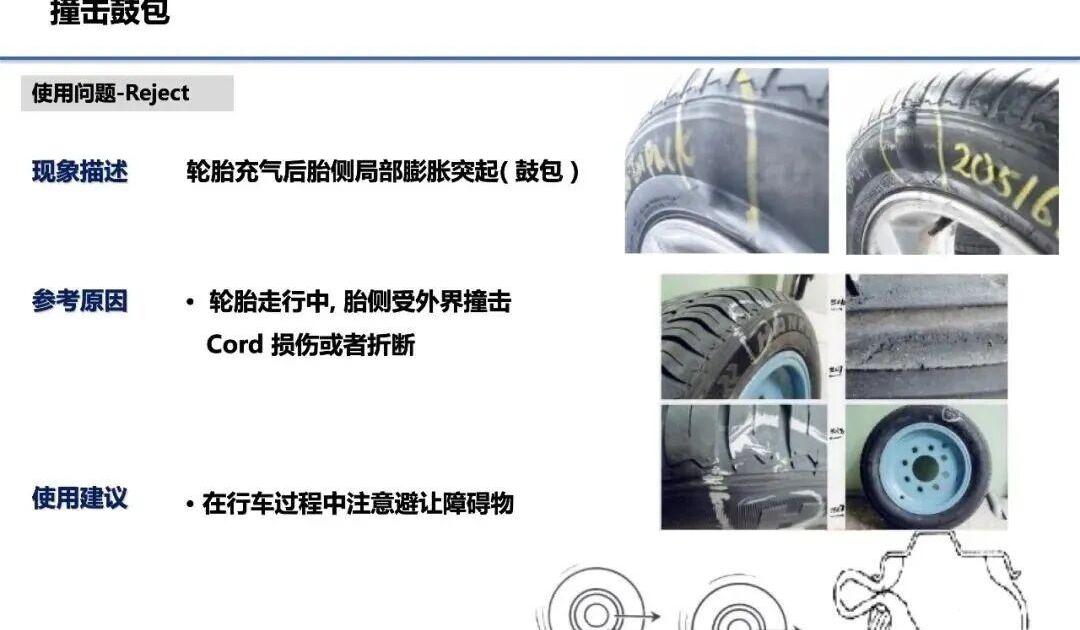
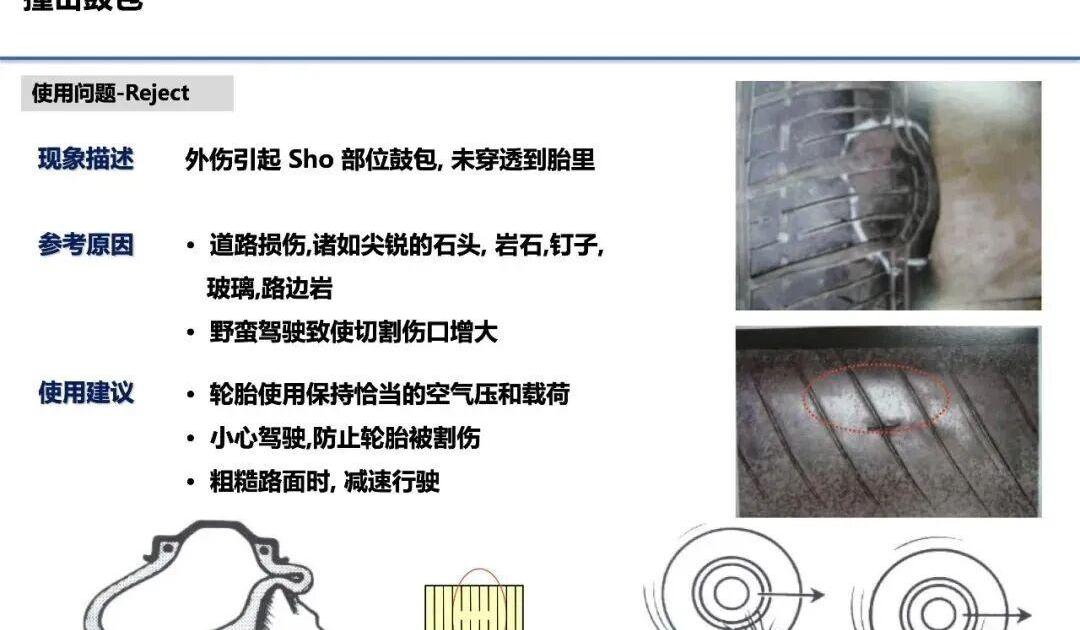
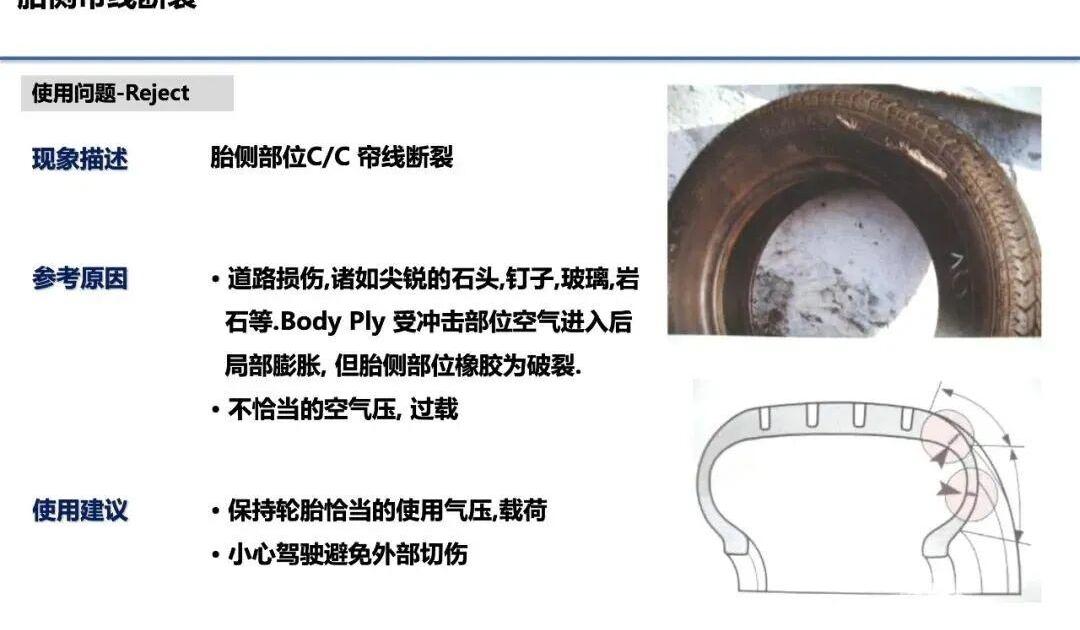
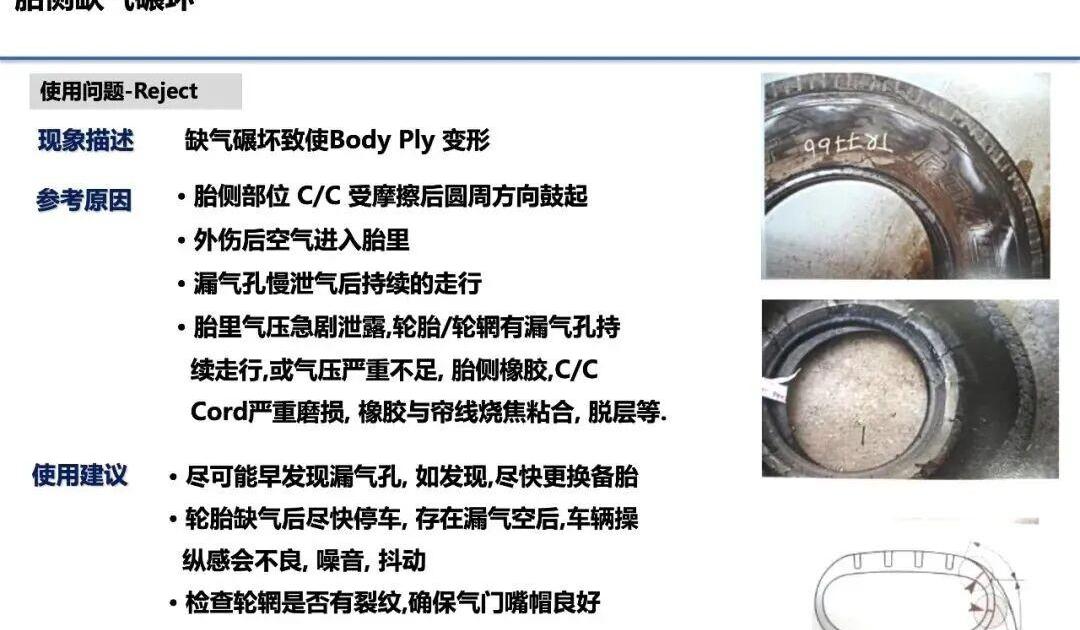
Below is the full training slide deck covering all common passenger tire failure types with real-world photos and explanations:
This study investigates why two identical extruder lines producing tire tread components show different quality consistency. We compared production batch sizes, die opening ratios, extrusion discharge and take-off temperatures, and line quality control methods. Results show that increasing batch sizes, optimizing operating methods, and setting proper plasticization temperatures can effectively improve tread yield.
Keywords: tire; tread extrusion; quality control; batch size; extrusion line; die opening ratio; plasticization temperature
Introduction
In tire manufacturing, mixed compound is plasticized in a screw extruder and discharged through a precision die, then stretched, cooled, and cut on a line to produce tread components. The tread is a critical tire component, and its quality control is a key focus of the semi-finished goods process — directly affecting material reuse rates.
Many factors cause tread quality variation: extrusion temperature fluctuations cause dimensional instability; die opening ratios and operating methods also contribute. The company runs two tread lines using hot-feed extruders from the same manufacturer and model (designated Line 1 and Line 2), but they show noticeably different quality consistency. This paper compares them to identify root causes and improve yield.
1. Measuring Tread Quality Variation
Using off-the-road (OTR) tire tread compound as an example, Table 1 shows the quality distribution and yield for both lines.
Table 1: Tread weight distribution and yield comparison
Weight variation / g
Accepted pieces
Yield / %
Line 1
±100
1,543
49.81
±150
2,085
67.30
±200
2,517
81.25
±250
2,786
89.93
±300
2,951
95.26
±350
3,048
98.39
Line 2
±100
3,309
77.35
±150
3,881
90.72
±200
4,115
96.19
±250
4,204
98.27
±300
4,277
99.98
±350
4,277
99.98
Note: Total pieces — Line 1: 3,098; Line 2: 4,278.
At ±100 g tolerance, Line 1 yield was only 49.81% vs. Line 2 at 77.35%. At ±200 g: 81.25% vs. 96.19%. At ±300 g: 95.26% vs. 99.98%. Both lines produce normally distributed weight, but Line 2’s distribution is much tighter; Line 1 is more spread out.
2. Root Cause Analysis
2.1 Production Batch Size
Table 2: Recent batch sizes per line (pieces)
Line
Avg of 10 batches
Batches under 100 pieces
Line 1
245
4 out of 10
Line 2
458
0
Line 1 averaged only 245 pieces per batch, with 4 of 10 batches under 100 pieces. Frequent small batches mean more start-up and end pieces that must be reworked, increasing weight variation. Line 2 averaged 458 pieces (1.87× Line 1), with every batch over 100 pieces — fewer changeovers and less rework material.
2.2 Die Opening Ratio
Final die shoulder-width opening ratios were 89.4% (Line 1) vs. 88.4% (Line 2). Cross-sectional area was 6,987.2 mm² (Line 1) vs. 6,952.4 mm² (Line 2); piece weight was 24.39 kg vs. 24.29 kg — essentially identical. Pre-die and base compound dimensions also matched closely. Die opening ratio is not the cause of the quality difference.
2.3 Extrusion Discharge and Take-Off Temperature
Compound supply temperature was 104.5°C for both lines (within spec). But the feed throat discharge temperature was 84.8°C (Line 1) vs. 88.8°C (Line 2) — a 4°C gap. Line 1 is older equipment with poorer temperature control; lower compound temperature means less uniform plasticization, contributing to variation.
Table 3: Temperature comparison (°C)
Line
Tread discharge
Base comp discharge
Cooling avg
Take-off temp
Line 1
135.3
127.6
33.9
55.2
Line 2
136.2
127.8
17.7
49.1
Line 2’s cooling water is 16.1°C colder on average, and take-off temperature is 6.1°C lower. Better cooling means more stable shrinkage and consistent piece weight.
The 300 mm cut-length shrinkage test showed: Line 1 tread shrank to 281 mm (5.7% shrinkage); Line 2 tread shrank to 245 mm (18.3% shrinkage) — 12.6% more. Higher shrinkage on Line 2 allows the component to stabilize fully on the line, resulting in less weight variation.
2.4 Line Parameters
Screw speeds and line speeds were nearly identical on both lines. The key difference was shrinkage control: Line 1 had a 300 mm shrinkage of only 5.7% vs. Line 2 at 18.3%. Cut length variation was 14 mm (Line 1) vs. just 5 mm (Line 2).
Line 1 operators can adjust weigh-bridge speed, post-weigh speed, and four-zone shrinkage speed; Line 2 has an automatic floating roller before the weigh bridge that self-adjusts, removing manual control. The primary causes of Line 1’s wider distribution are smaller batch sizes and lower shrinkage rate; secondary causes are lower extrusion supply temperature and higher take-off temperature.
3. Corrective Actions
Increase batch sizes on Line 1 to minimize start-up/end-piece rework and weight variation.
Raise extruder temperature setpoints by 5–10°C at all control zones on Line 1 for more uniform compound plasticization.
Add cooling towers to lower cooling water temperature, reducing take-off temperature and stabilizing finished piece weight.
4. Conclusion
Comparing two identical tread extrusion lines revealed that batch size, compound plasticization temperature, and cooling efficiency are the key drivers of weight consistency. Increasing production batch sizes, raising extrusion temperatures 5–10°C, and lowering take-off temperature through better cooling dramatically improved tread yield on Line 1.
EU passenger vehicle CO₂ regulations are driving automotive R&D toward new materials and technologies that improve energy efficiency. A key avenue is reducing tire rolling resistance to improve fuel economy, while maintaining or even enhancing safety and service life. “Green tires” have already significantly cut rolling resistance by using synthetic elastomer blends with silica-silane filler systems. Functionalizing the elastomer can further improve silica-rubber interaction for additional performance gains. This study prepared model tread compounds using functionalized and non-functionalized elastomers with various silica grades and loadings, characterizing processability, cure behavior, and static/dynamic mechanical properties. Results show that elastomer functionalization affects nearly all tread properties: pre-cure filler-rubber interactions increase compound viscosity and hurt processing, but functionalized rubber in model tread formulations lowers rolling resistance (tanδ) without significant mechanical property loss.
Road transport continues to grow: EU road transport greenhouse gas emissions rose over 30% from 1990–2019, with 70%+ from light commercial vehicles and passenger cars. EU regulations mandate: 55% and 50% CO₂ cuts for new passenger and van vehicles by 2030–2034 vs. 2021, and 100% reduction by 2035. Carmakers are reducing emissions through aerodynamics, engine efficiency, and new powertrains. Lowering tire rolling resistance is another major lever: less power is needed to maintain motion, cutting fuel consumption and heat buildup. For EVs, rolling resistance directly affects range.
Tread compound is the core factor determining rolling resistance. Early treads used emulsion SBR with carbon black — a trade-off among rolling resistance, wear, and grip where improving one worsens others. In the early 1990s, “green tires” appeared: SBR/BR blends with silica-silane filler systems, simultaneously improving rolling resistance and wet grip while maintaining wear — the so-called “magic triangle.”
Current research focuses on rubber functionalization; several commercial functionalized SBR grades exist. The goal is improving the interfacial interaction between rubber and fillers, especially silica in modern passenger tires.
1.2 Objectives
Primary: investigate how functionalized SBR affects tread compound processability, static mechanicals, and dynamic performance. Secondary: study elastomer blends, different silica surface areas, and varying silica loadings.
2. Literature Review
2.1 Brief History of Rubber
The earliest recorded rubber use dates to the late 15th century — Indigenous South Americans collected tree latex for ceremonial balls and waterproofing. In the 18th century, “rubber” and “caoutchouc” entered Western vocabulary. John Hancock’s masticator machine revolutionized processing. In 1839, Charles Goodyear discovered vulcanization — adding sulfur and accelerators under heat dramatically improved tensile strength, wear, and solvent resistance, enabling rubber’s entry into tire manufacturing.
Natural rubber (NR), from Hevea brasiliensis, boomed with bicycles and automobiles in the late 19th–early 20th century. Plantations spread to Sri Lanka and Singapore after 1876; global output grew from ~100,000 tons in 1909 to over 14 million tons by 2021. To address supply gaps, synthetic rubber development began as early as 1906. Butadiene rubber (BR) was among the first successful synthetics; SBR (styrene-butadiene copolymer) followed. Both remain widely used in tread compounds.
2.2 Tread Elastomers
Natural rubber (cis-1,4-polyisoprene) has high molecular weight, low Tg, and strain-induced crystallization — delivering high tensile strength, excellent wear and tear resistance. Off-road tires can contain up to 45% NR by weight. However, NR has poor oil/ozone resistance and weak wet grip, so high-speed passenger treads replace it with synthetics.
Butadiene rubber (BR) — high-cis BR (>90% cis) is preferred for treads: linear chains give strain-induced crystallization, low Tg, excellent wear, resilience, fatigue life, and tear strength. BR’s main weakness is poor wet grip, so it is blended with SBR.
Functionalization has four routes: (1) initiator end-group functionalization; (2) chain-end capping; (3) functional monomers during copolymerization; (4) post-modification of side-chain vinyl groups. Tread SBR typically incorporates polar functional groups to improve affinity with polar silica filler — better dispersion, fewer agglomerates, stronger filler-polymer interaction, lower heat buildup at high temperature (better rolling resistance), and improved wet grip. The trade-off: bulky functional groups restrict chain mobility, raising compound Mooney viscosity and worsening processability.
2.3 Reinforcing Systems
Reinforcing fillers improve both tensile strength and modulus while maintaining elongation. Carbon black and silica are the dominant choices. Silica surfaces have abundant silanol groups; silane coupling agents react with silanol on one end and rubber chains during vulcanization on the other, building a silica-silane-rubber bridge. After curing, covalent bonds create strong interface coupling. Silica-silane systems vs. comparable carbon black: higher modulus, better tear/wear, and improved dynamic hysteresis — enabling near-carbon-black wear with better wet grip, lower rolling resistance, and less heat buildup.
2.4 Viscoelasticity
Rubber is viscoelastic — both elastic and viscous. DMA applies sinusoidal strain and measures stress response. Storage modulus (G’/E’) is the elastic component; loss modulus (G”/E”) is the viscous component; tanδ = G”/G’ characterizes energy loss. Temperature sweeps from -80°C to 80°C produce the tanδ-temperature curve: tanδ at 0°C indicates wet grip; tanδ at 60°C indicates rolling resistance; the peak corresponds to Tg.
2.5 Tire Performance
EU tire labeling (mandatory since 2012, updated 2021) covers rolling resistance, wet grip, and noise, with new snow/extreme climate markings. Tire noise comes primarily from the “air pumping effect” — air squeezed out of tread grooves on contact and released on separation. Rolling resistance is the second largest energy loss in ICE vehicles after drivetrain; DMA tanδ at 60°C is the lab proxy. Wet grip depends on both compound and groove water evacuation; tanδ at 0°C evaluates intrinsic compound grip.
3. Experimental
3.1 Materials
Three high-dispersion silica grades with increasing surface area were used: Solvay Zeosil 1165MP (bead form), Evonik Ultrasil 7000GR and Ultrasil 9100GR (granulated form). Compounds followed classic green-tire formulations with silica-silane systems. Four series were prepared:
S1: Two pure SBR grades compared (non-functionalized vs. end-functionalized)
A Brabender Plastograph 350E internal mixer was used, followed by a Polymix 80T two-roll mill. Three mixing stages: masterbatch (rubber + silica + additives), remill (accelerators), and final (sulfur). Fill factor 66%; initial chamber temperature 50°C; 50 rpm. Cure was on a Wickert WLP 1600 press at 100 bar, 160°C. Because silica compounds show marching modulus from flocculation, all cures were completed within 16–20 hours after mixing. Fixed cure time of 30 min (35 min for thick cylindrical specimens).
3.3 Characterization
Mooney viscosity: Alpha Mooney 2000, ISO 289, ML(1+4) at 100°C
Payne effect: TA-RPA Elite, 60°C, 1.667 Hz, strain sweep 0.075%–100%; ΔG’ between low and high strain evaluates filler network
Cure characteristics: RPA Elite, ISO 6502, 0.5° strain, 1.67 Hz, 160°C, 30 min
Hardness: Zwick Shore A, ASTM D2240
Tensile: Zwick Z01, ISO 37, dumbbell specimens, 500 mm/min
Rebound: Zwick 5109, ISO 4662
DMA: Metravib Visco-analyser 2000, ISO 4664, -80°C to +80°C, 2°C/min, 10 Hz, tension mode
4. Results and Discussion
4.1 Series 1: Pure SBR — Functionalized vs. Non-functionalized
SBR 4601 = non-functionalized; SBR 4602 = end-functionalized. At equal silica loading, functionalized SBR 4602 showed higher mixing torque and discharge temperature due to pre-cure silica-rubber interaction. Mooney viscosity was significantly higher for 4602, and the gap widened with silica loading. Payne effect ΔG’ was also higher for 4602, indicating stronger filler-rubber interaction and network.
Minimum torque (S’min) was higher for 4602; scorch time (ts2) slightly shorter. Hardness increased nearly linearly with silica loading, with minimal difference between SBR grades. Tensile strength and elongation at break were comparable. Rebound decreased with silica loading, with little difference between SBR grades.
At 60 phr silica: Tg was similar; 60°C tanδ was lower for 4602 (better rolling resistance); 0°C tanδ was comparable (similar wet grip). The mechanism: end-group functionalization strengthens silica-rubber bonding, reducing free chain ends and hysteresis loss.
4.2 Series 2: SBR/BR 80/20 — BR Grade Comparison
The viscosity/torque difference between SBR 4601 and 4602 was partially mitigated by adding 20 phr BR. BR grade had minor effects; the dominant variable remained SBR functionalization. Mixing temperature was slightly higher with CB-24 vs. Cis-132 (likely day-to-day variation). Mooney and Payne effect followed the same SBR-functionalization trend.
SBR 4602 showed higher S’min; replacing with CB-24 extended scorch time except at 90 phr. Hardness was governed by silica loading. Tensile and rebound were similar between BR grades. Adding BR shifted Tg lower; 0°C tanδ dropped slightly (some wet grip loss); 60°C tanδ was slightly lower.
4.3 Series 3: SBR 4602/Cis-132 — Blend Ratio (100/0, 80/20, 60/40)
Higher BR content improved processing slightly. Mooney viscosity decreased with BR content. Payne effect ΔG’ decreased as BR increased — weaker filler network. Both S’min and S’max decreased with BR content.
Hardness was nearly independent of blend ratio, governed by silica loading. Higher SBR content raised M100 and M300 modulus; increasing BR lowered modulus and raised elongation. Rebound improved significantly with BR (Cis-132 has much higher resilience than SBR 4602). DMA: higher BR shifted Tg lower; 0°C tanδ dropped noticeably (worse wet grip); 60°C tanδ rose slightly (slightly worse rolling resistance).
Trade-off: More BR improves wear but sacrifices wet grip and slightly worsens rolling resistance.
4.4 Series 4: Silica Surface Area (80/20 blend)
Z1165MP = low surface area; U7000GR = medium; U9100GR = high. Higher surface area silica increased mixing torque, discharge temperature, and Mooney viscosity. U9100GR with functionalized SBR at ≥75 phr was very difficult to process. Z1165MP had the lowest processing load.
Payne effect ΔG’ increased with surface area — stronger filler network. U9100GR showed dramatically higher ΔG’ than the other two. Functionalized SBR 4602 consistently showed higher ΔG’ than 4601.
Higher surface area gave higher modulus at equal loading. Rebound was higher with lower surface area silica (less filler-filler interaction, less hysteresis). DMA: near Tg, U9100GR showed lower tanδ due to more bound rubber and constrained polymer layers. At 0°C, Z1165MP had the highest tanδ (best wet grip); at 60°C, Z1165MP had the lowest tanδ (best rolling resistance). Higher surface area worsened both wet grip and rolling resistance but offered wear potential.
5. Conclusions
5.1 Summary
Processing: Functionalized elastomers worsen processability — pre-cure silica-rubber interaction raises viscosity. SBR/BR blending can offset this. Do not pair high-surface-area silica with functionalized SBR — viscosity spikes make mixing extremely difficult. Low-surface-area silica allows higher loading with acceptable processing.
Cure: Functionalization has only minor effects on cure characteristics. Silica loading and surface area significantly affect cure — above the percolation threshold, torque is governed by filler network; surface area changes crosslink density.
Mechanicals: Functionalization has no significant negative impact on static properties. Higher BR content reduces some moduli. Changing silica surface area alters mechanics via crosslink density.
Dynamic performance: Functionalized SBR in green tread formulations modestly improves both rolling resistance and wet grip. More BR improves wear but hurts wet grip and slightly worsens rolling resistance. Higher surface area silica improves wear potential but hurts processing and rolling resistance. Low-surface-area silica gives better rolling resistance at some wear cost.
5.2 Recommendations
Processing: When using functionalized SBR, pair with low-to-medium surface area silica; at high loadings, must use SBR-BR blends to offset viscosity; avoid high-surface-area silica directly with end-functionalized SBR.
Curing: Strictly control the time between mixing and curing for silica compounds to suppress marching modulus from flocculation; re-optimize cure conditions for each silica grade.
Mechanicals: SBR/BR blend ratio is the key lever for balancing wear vs. wet grip; higher BR improves wear but lowers modulus and grip — optimize through small-scale trials.
Dynamics: To balance rolling resistance and wet grip, functionalized SBR with medium-surface-area silica is a promising combination; high-surface-area silica suits applications prioritizing wear over rolling resistance.
https://www.hbtrubber.com/wp-content/uploads/2026/09/header_2583b.jpg6751200zhaohttps://www.hbtrubber.com/wp-content/uploads/2026/03/LOGO-3.pngzhao2026-09-27 14:42:072026-09-28 02:41:51Functionalized Rubber for Tire Tread Compounds: Performance Study
Carcass cord bulge failure in truck and bus radial (TBR) tires predominantly occurs in the shoulder area and is a critical issue affecting tire performance and safety. This study examined 13 market-returned failed tires of various patterns and sizes through a multi-step analytical methodology: visual inspection, X-ray detection, shearography, microscopic analysis, FTIR spectroscopy, and adhesion testing to characterize the failure mechanism.
Visual inspection identified external causes such as punctures, overload, and bead damage; X-ray ruled out structural defects like uneven cord spacing or belt misalignment, indicating that failure originated from intrinsic interface interactions. Shearography located early latent delamination, which was then examined microscopically. Microscopy revealed that the initial failure mode was carcass ply-rubber interfacial debonding, with cracks propagating along cord surfaces and spreading to adjacent cords. FTIR combined with 90° peel testing distinguished rubber bulk degradation from adhesive layer aging. FTIR confirmed stable chemical state with no carbonyl formation or olefin/vinyl group loss. However, adhesion testing showed reduced bond strength correlated with bulge initiation: samples without bulge initiation had a minimum bond strength of 13 kgf/inch, while samples with visible initiation had a maximum bond strength of only 13 kgf/inch. This proves that adhesive layer aging is the root cause of failure. This study reveals the TBR cord bulge failure mechanism and establishes a complete failure root-cause analysis methodology.
Like all mechanical components, tires have a defined service life, measured in miles — the distance a tire can travel under specific load and operating conditions. When manufacturers receive feedback that actual tire life falls short of design expectations, the root cause must be identified. Such failures not only harm profitability and sales but also trigger customer tire replacement claims.
Over the past decade, the TBR tire industry completed its radial technology transition, with continuous focus on improving mileage. Early research centered on tread friction; later work shifted to heat dissipation and rolling resistance reduction. Since 2020, TPMS and AI have been increasingly used to improve tire performance and optimize manufacturing.
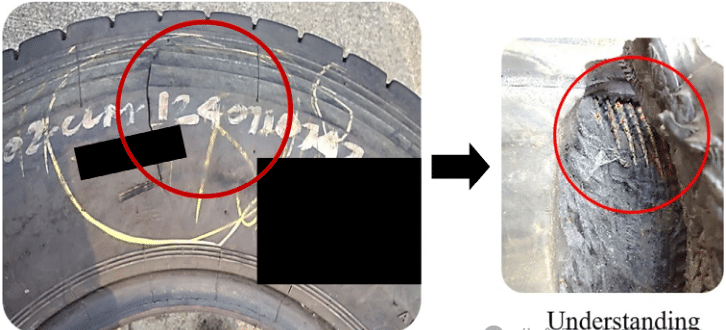
Despite technological advances, various tire failure modes remain persistent industry challenges. Common modes include tread delamination, belt delamination, and sidewall delamination. Among these, carcass cord bulge failure is particularly severe, causing tire carcass deformation. In this mode, the carcass ply displaces inward toward the inner liner; air penetrates the interface, forming a bulge on the outer surface that eventually bursts. This is also called ply separation — the ply delaminates from the sidewall rubber. Such blowouts cause loss of vehicle stability and increase accident risk (Figure 1).
Figure 1: TBR tire carcass cord bulge failure. Left: failure location; Right: magnified view of failed area
Extensive literature covers various tire failure mechanisms: belt delamination has been thoroughly studied (belt angle, rubber thickness, belt width); crack propagation direction has been investigated using optimization methods. Tread delamination and bead failures are also well documented. Giapponi (2008) comprehensively reviewed tire failure causes. However, published research specifically on carcass cord bulge failure remains very limited — only Jeong et al. (2019) used FEA to predict and optimize structural durability. Significant research gaps remain.
Tire failure causes are diverse — overload (e.g., running at 200% rated load), puncture, manufacturing defects. This study distinguishes whether cord bulge originates from cohesive failure of the rubber bulk or adhesive failure at the steel cord-rubber interface. The core question: what causes adhesion degradation? Is it aging thickening the copper sulfide (CuₓS) adhesive layer making it brittle, or thermo-oxidative degradation of the rubber bulk from prolonged heat and air exposure in the shoulder region?
To answer this, manufacturing defects and misuse were excluded from analysis; crack nucleation and propagation paths were traced to determine failure location and mechanism. This study proposes a systematic verification methodology, analyzing 13 market-returned failed TBR tires of different models, operating conditions, sizes, and tread patterns: 8 from Salem market, 5 from Bikaner market (Table 1).
Table 1: Tire models and operating conditions (13 samples of TBR tires including tubed and tubeless, sizes 9R20, 10R20, 295/80R22.5; wear ranging from 19% to 69%).
This paper is structured as: Section 2 provides theoretical background on composite failure, tire tension distribution, rubber aging, and rubber-steel adhesion; Section 3 describes the experimental methodology; Section 4 presents results; Section 5 gives conclusions.
2. Theoretical Background
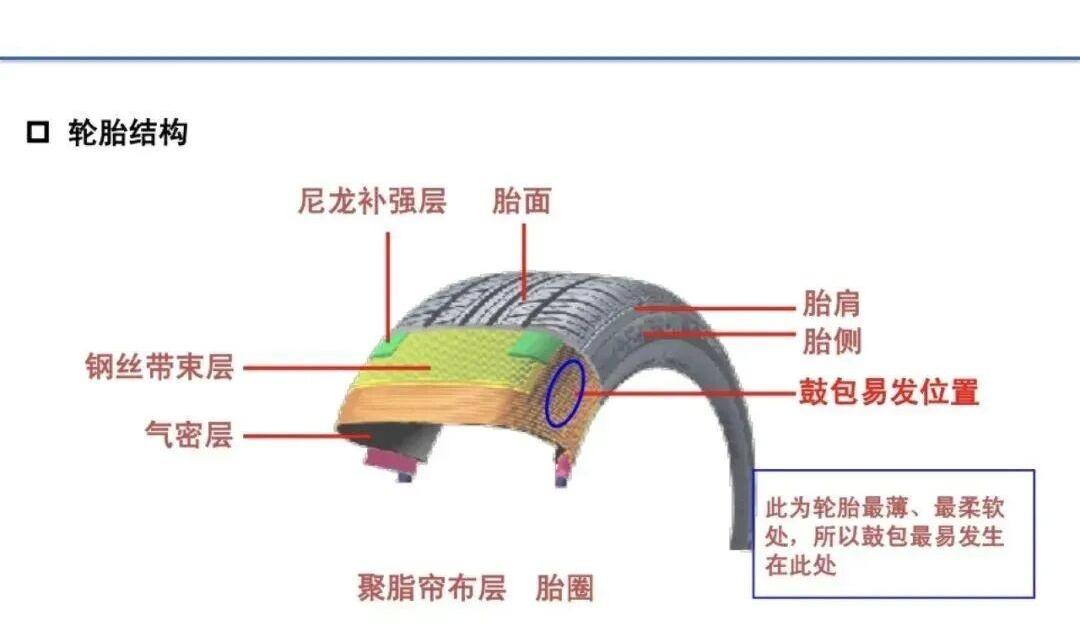
A tire is a complex composite of 30+ components. A typical TBR tire includes tread, belt plies, carcass ply, sidewall, inner liner, apex, and bead wire. TBR tires generally contain 5 steel cord plies, 4 belt plies, and 1 carcass ply. Steel cords are coated with thin rubber called the skim compound. This is a fiber-reinforced rubber (FRR) composite: fiber phase = steel cords, matrix = rubber. Each ply is a lamina; stacked laminae form a laminate.
2.1 Load Transfer and Damage Mechanisms
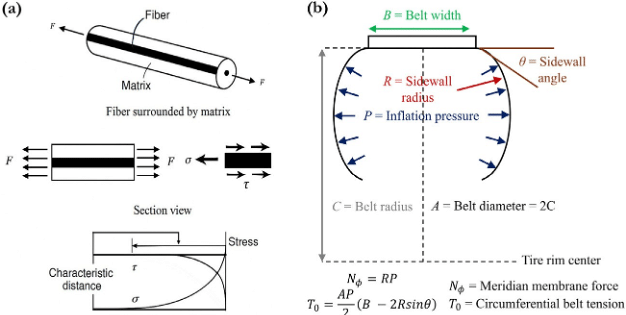
In composites, most load is borne by fibers; the matrix holds fibers in place. Under axial tension, fibers transfer load to the matrix via interfacial shear stress. Initially fibers carry maximum tensile stress; shear stress is lowest at the fiber surface and increases toward the matrix, reaching a maximum before dropping to zero (Figure 2a).
Figure 2: (a) Load transfer under fiber tension (Hyer & White, 2009); (b) Tension on carcass plies and belts in a radial tire (Yamagishi et al., 1987)
Inside the tire, inflation pressure tensions the belts and carcass plies. Carcass ply tension relates to curvature radius; belt tension depends on outer diameter, width, and belt angle (Figure 2b). Complete laminate failure requires multiple local damages first. Damage mechanisms in fiber composites fall into three categories:
Micro-mechanical damage: within a single lamina;
Macro-mechanical damage: at the laminate level;
Micro-macro coupled damage: cracks initiate within a lamina then propagate into interlaminar delamination.
2.2 Rubber Degradation
Under environmental factors and mechanical loading, tire rubber degrades over time, compromising structural integrity. Degradation has two modes: thermo-oxidative aging (oxygen + heat cause chain scission, reduced elasticity, increased hardness, cracking) and mechanical aging (continuous deformation during rolling causes progressive damage, fatigue crack initiation at stress concentrations).
Crack initiation in cord bulge occurs near the carcass ply where skim rubber is extremely thin, preventing direct physical comparison between failed and new tires. FTIR was used to assess aging by identifying chemical changes through characteristic absorption peaks. Thermo-oxidative aging produces abundant carbonyls while reducing olefinic/vinyl groups; mechanical aging produces both alcohol and carbonyl groups.
2.3 Rubber-Steel Adhesion and Degradation
Tire steel cords are brass-plated; adhesion relies on the copper-zinc alloy layer. During vulcanization, rubber reacts with brass to form a copper sulfide (CuₓS) interlayer that mechanically interlocks with the crosslinked rubber network. Compounding ingredients — accelerators, sulfur, cobalt salts — are critical for promoting metal-sulfur interaction.
Loss of steel-rubber adhesion is mainly caused by thermal aging, oxygen exposure, and moisture. Thermal aging thickens the CuₓS layer (brittle, crack-prone); oxygen oxidizes CuₓS to CuSO₄ (poor cohesive strength); moisture + oxygen cause cathodic corrosion producing Zn²⁺ and Zn(OH)₂. This study uses the 90° peel test to evaluate carcass ply-rubber bond strength.
3. Experimental Methods
3.1 Visual Inspection
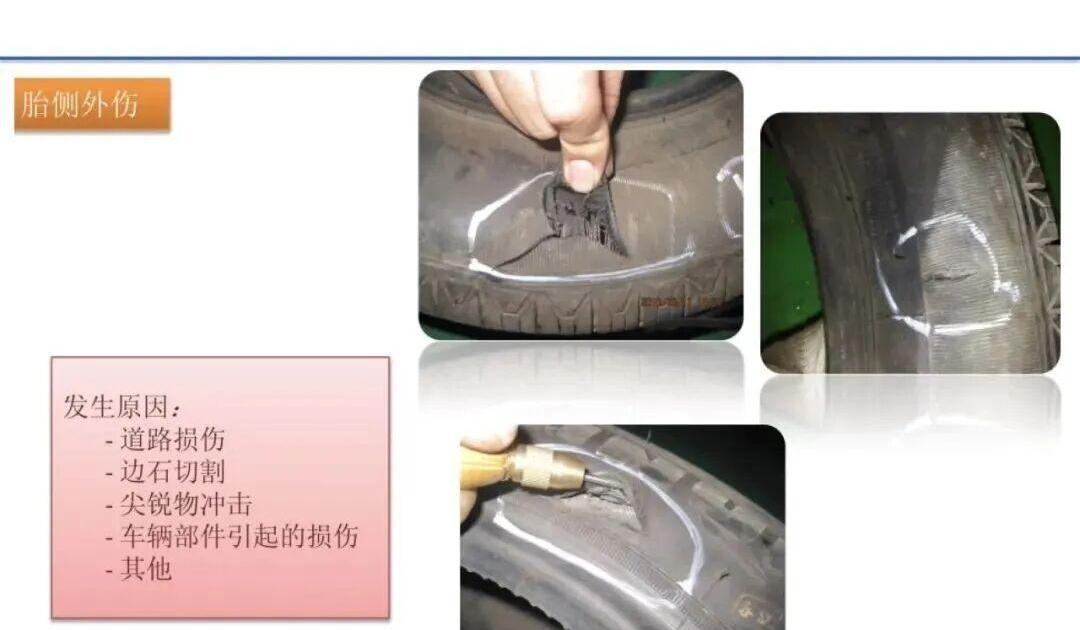
Comprehensive visual inspection assessed whether puncture, impact, overload, or overheating triggered cord bulge. All tires were cleaned; serial-number side (SS) and non-serial side (NSS) were marked. Failure locations were recorded, checking for punctures, inner liner splice failures, bead damage, and flat spots — defects that allow moisture/air ingress.
3.2 X-Ray Inspection
After visual inspection, X-ray identified defects in belt, sidewall, and bead areas, focusing on manufacturing-related structural damage to steel components. Locating pins were inserted opposite the marked failure area. Focus was on upper sidewall region and carcass cord spacing — excessive or uneven spacing allows rubber deformation under inflation pressure, thinning and eventual tearing. Irregular spacing near failure was flagged as a potential building drum (TBM) defect.
3.3 Shearography
Shearography is a laser technique detecting internal voids and delamination under varying pressure/temperature. After X-ray, shearography identified early latent delamination invisible to the naked eye. Three scans covered 8 sectors (45° each) around the 360° circumference: lower sidewall, crown, and upper sidewall.
3.4 Microscopic Analysis
After shearography marked latent delamination areas, thin sections were cut using a diamond wire tire cutter. A DinoLite Premier AM7013MZT4 digital microscope examined specimens; an awl was used to open crack initiation zones. The primary goal was to locate the exact crack origin, then study propagation direction across multiple sections.
3.5 FTIR Spectroscopy
ATR-mode FTIR tested whether crack initiation was caused by rubber degradation. Skim rubber samples were taken from cord surfaces at both crack-initiation and sound areas. Two new tires served as controls: one fresh, one artificially aged in a climate chamber (100°C, 50% N₂ + 50% O₂, 30 days). Comparisons were made between: (1) new, worn-market-returned, and lab-aged tires; (2) cracked vs. uncracked areas on the same tire.
3.6 Adhesion Testing
A universal testing machine (UTM) performed 90° peel tests to confirm whether crack initiation was caused by bond strength loss. Two groups were prepared: Group A — market-returned bulged tires without visible shoulder crack initiation; Group B — same bulged tires with visible crack initiation. Both groups were peel-tested and compared.
4. Results and Discussion
4.1 Visual, X-Ray, and Shearography Results
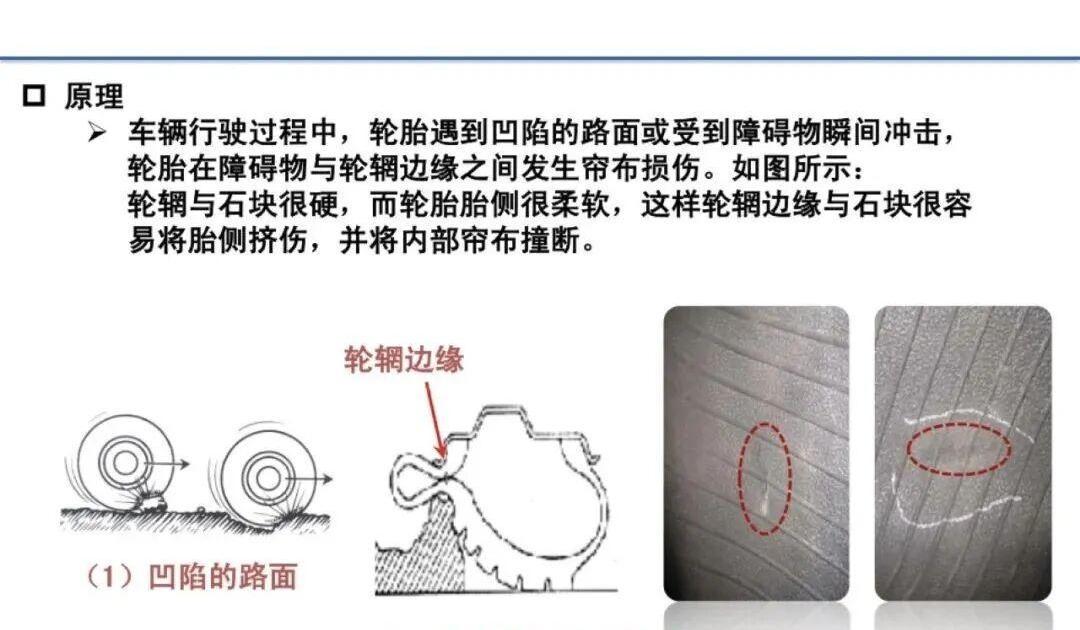
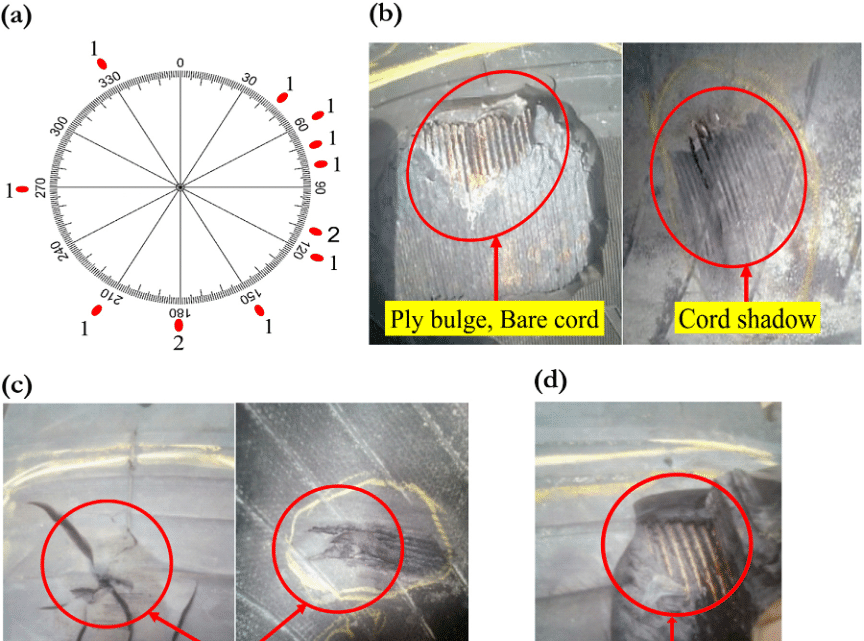
Visual inspection found that cord bulge failure predominantly occurred in the upper sidewall, with no preference for SS or NSS — failure could occur at any circumferential position (Figure 4a). All failed tires showed cord shadowing inside and exposed cords externally (Figure 4b). Of 13 tires, 3 had punctures, but only 2 were adjacent to the failure. Flat spots from hard braking were observed near failures; one tire had impact damage directly at the failure (Figure 4c,d).
Figure 4: Visual analysis — (a) circumferential distribution of failure; (b) exposed cords and cord shadowing; (c) impact-induced failure; (d) flat-spot-induced failure
Excluding tire #3, average wear was 48.53%. Salem market averaged 56.97% wear; Bikaner averaged 36.73% — lower in Bikaner because overloading causes early bulge failure before significant wear. External factors (impact, puncture, flat spot, overload) accelerate local stress accumulation and promote bulge failure.
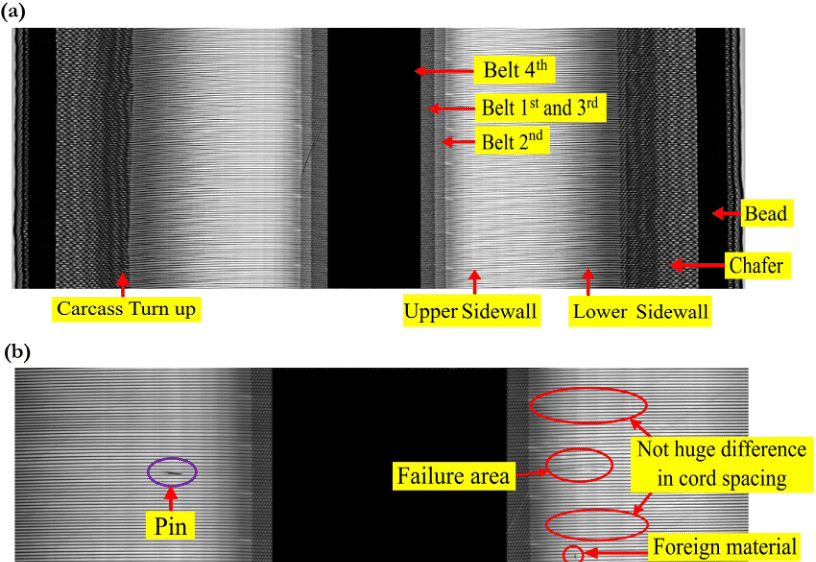
Figure 5: (a) X-ray identifying tire components; (b) Failed tire X-ray showing failure area with normal cord spacing (no manufacturing defect)
X-ray showed no significant manufacturing defects — cord spacing near failure was within acceptable range (Figure 5), confirming that bulge failure is not manufacturing-related.
Shearography showed varying interference fringe patterns indicating delamination severity. Six tires (#1, 2, 7, 10, 11, 12) showed early latent ply delamination in the turn-up area, belt edges, and shoulder ply — these isolated locations represent true delamination origins and were sampled for microscopy.
4.2 Sectioning and Microscopy
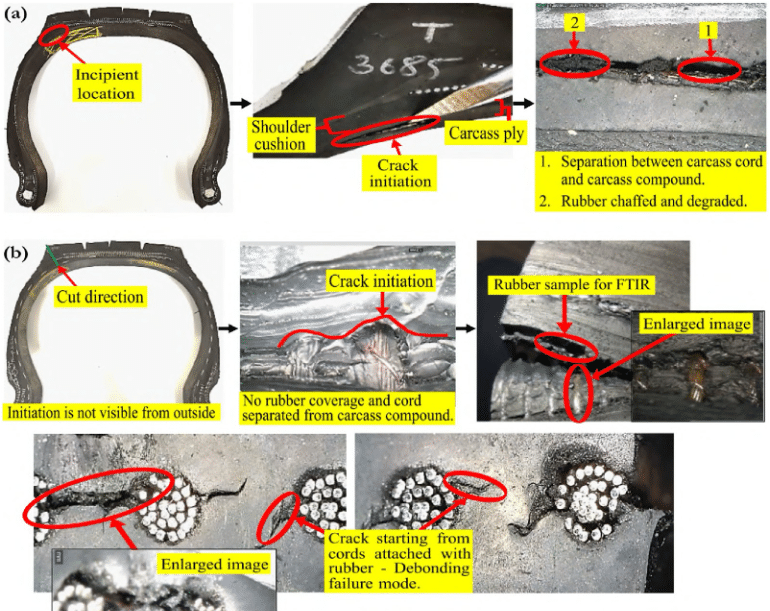
All sections were checked for geometric deviations (belt offset, turn-up offset, gauge thickness) — all within tolerance. Microscopy of the 6 latent-delamination samples confirmed that cracks initiated within the carcass ply, just below the shoulder wedge compound. Clear separation between cords and skim rubber was observed; at initiation, rolling/wear had removed rubber from cord surfaces but the brass plating remained intact. Cracks initiated at the cord-rubber interface, not within the rubber bulk — interfacial debonding along individual cords, then spreading to adjacent cords.
Figure 6: Microscopic analysis — (A) section macro view; (B) internal micrograph showing crack initiation at the carcass cord-rubber interface
4.3 Crack Initiation and Propagation Mechanism
From a composites perspective, each ply is an independent lamina — failure originates within a single carcass ply lamina, not between plies. It begins as transverse fiber-matrix debonding along steel cords, driven by stress concentration and interface degradation. Once debonding reaches sufficient length, the crack enters the rubber matrix and spreads to adjacent cords — a micro-macro coupled damage mode. Cracks grow across 2–4 cords, causing macroscopic delamination that separates the carcass ply from surrounding structure. Delamination leads to ply tearing, inner liner breach, gas leakage, sidewall bulge, and catastrophic blowout.
Some cord areas showed reddish-brown discoloration — oxidation of the steel cords.
4.4 FTIR Results
FTIR focused on carbonyl, olefinic, and vinyl regions. Oxidative degradation increases carbonyl/hydroxyl/ether signals (1800–1700 cm⁻¹ carbonyl; 3400–3300 cm⁻¹ hydroxyl; 1200–1000 cm⁻¹ ether) and decreases olefinic C=C (1660–1640 cm⁻¹) and vinyl signals (910–890 cm⁻¹).
Crucially, no carbonyl formation was detected in market-returned tires — oxidation was not the dominant reaction, likely because antioxidants scavenged carbonyl products into secondary amines/imines/nitroso byproducts. Vinyl and olefinic groups showed no significant decrease vs. new tires. In contrast, climate-chamber aged samples showed severe degradation (vinyl nearly vanished, olefins dropped). Conclusion: rubber bulk degradation is minimal and not the failure cause.
4.5 Adhesion Test Results
New tire bond strengths: crown area 23 kgf/inch; sidewall 100 kgf/inch. Market-returned tires tested lower than new-tire standards, so relative comparison between Group A (no crack initiation) and Group B (crack initiation) was used.
Table 2: Peel adhesion test results — Group A (no initiation) consistently showed higher bond strength than Group B (with initiation) across both ply-to-belt and ply-to-sidewall interfaces.
Figure 10: Ply-to-belt interface after 90° peel test — Group A (no initiation) shows cohesive failure; Group B (initiated) shows mixed adhesive-cohesive failure
Group A (no crack initiation) showed cohesive failure with rubber coverage >3; Group B showed mixed adhesive-cohesive failure. Key finding: Group A minimum bond strength ≈ 13 kgf/inch; Group B maximum bond strength ≈ 13 kgf/inch — a clear threshold separating sound from initiated tires.
5. Conclusions
This study systematically investigated TBR carcass cord bulge failure, filling a literature gap. The failure sequence: interfacial weak layer breakdown → cord-rubber debonding along shoulder cords → stress concentration under rolling loads → crack propagation to adjacent cords → ply separation → inner liner breach → gas leakage → sidewall bulge → catastrophic blowout.
Key findings:
External factors: Impact, puncture, flat spots, and overload accelerate local stress buildup and promote bulge failure.
Manufacturing factors: X-ray and sectioning confirm no abnormalities in cord spacing, gauge, or belt alignment — failure is not manufacturing-related.
Rubber bulk aging: FTIR confirms the carcass rubber remains chemically sound; antioxidants effectively suppress degradation — rubber bulk aging is not the cause.
Adhesive layer degradation: The root cause is aging of the cord-rubber adhesive interlayer. Microscopy and 90° peel testing confirm reduced bond strength in tires with crack initiation.
Two directions for delaying TBR cord bulge failure: (1) improve cord-rubber adhesion through new skim compound formulations and optimized brass plating in coordination with cord manufacturers; (2) structural optimization — adjust carcass ply curvature for more uniform tension distribution, and modify belt structure for greater circumferential stiffness. These measures will improve tire performance, extend mileage, and reduce commercial tire blowout risk.
We use cookies to improve your experience on our site. By using our site, you consent to cookies.
This website uses cookies
Websites store cookies to enhance functionality and personalise your experience. You can manage your preferences, but blocking some cookies may impact site performance and services.
Essential cookies enable basic functions and are necessary for the proper function of the website.
Name
Description
Duration
Cookie Preferences
This cookie is used to store the user's cookie consent preferences.